Editor's Note: This article was originally published in Martin Pring's Market Roundup on Tuesday, June 18th at 2:30pm ET.
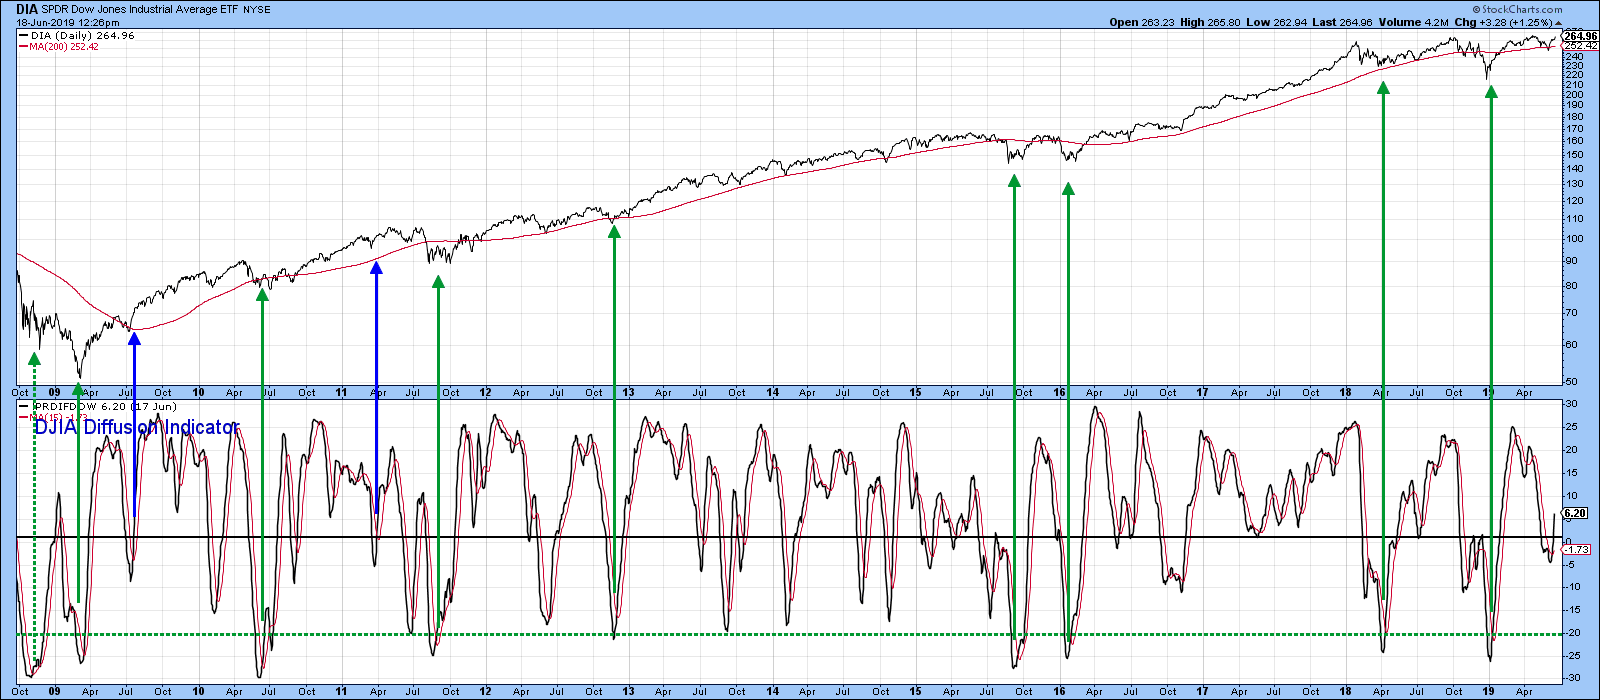
Several reliable short-term oscillators have just turned bullish. Chart 5, for instance, features my Dow Diffusion Indicator. This one is similar to the Global Oscillator, but uses DJIA components instead. The green arrows show when it reverses to the upside from a position below the oversold line. The indicator recently turned up again, but not from such a subdued level. As long as it can continue to power its way higher, it represents a positive backdrop. Chart 5
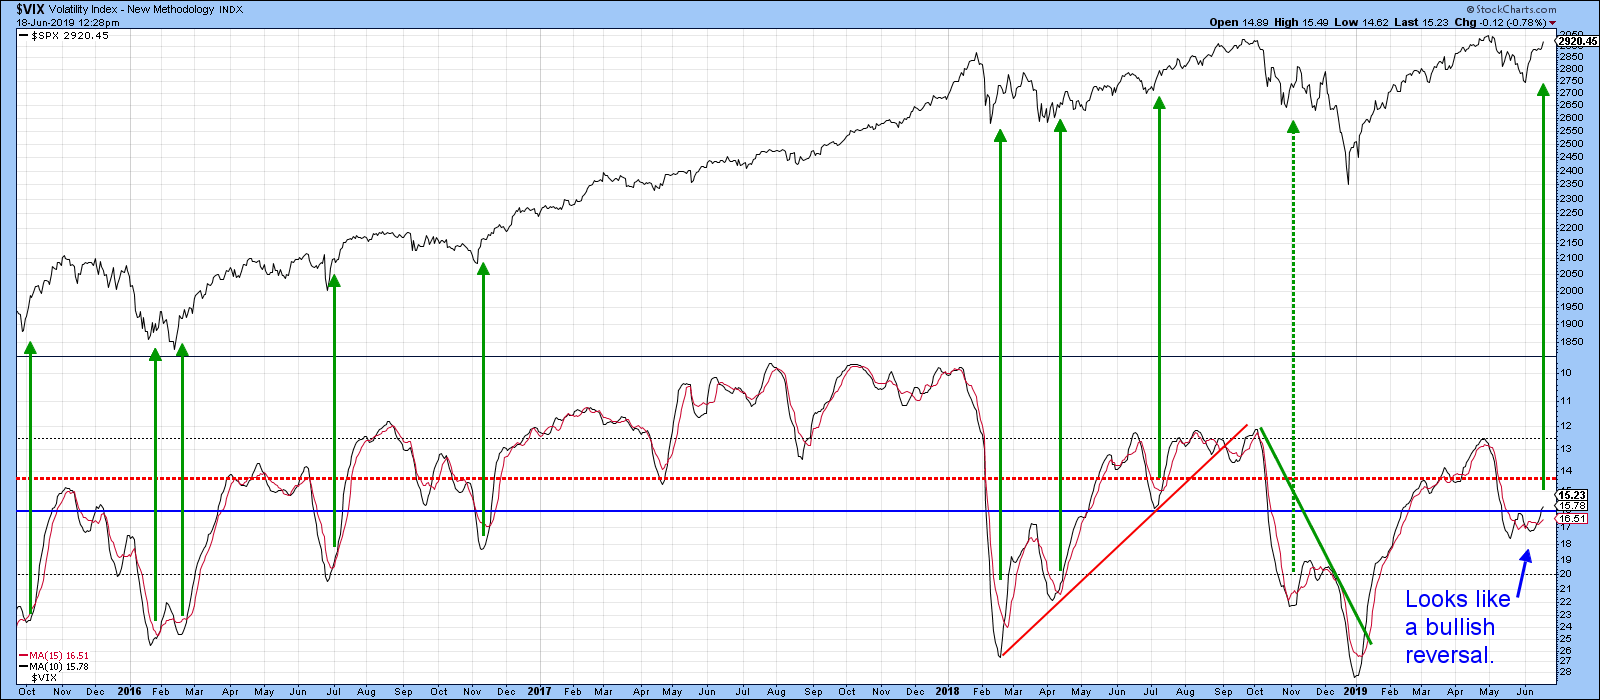
Chart 6 calculates a couple of moving averages for the VIX and plots them inversely. That allows swings in this indicator move in the same direction as the S&P Composite. The green arrows flag periods when the 10-day MA reverses to the upside from a position below or at the blue horizontal line. It essentially tells us that the period of rising volatility and falling prices has ended. That indicator went bullish a few sessions ago.
 Chart 6
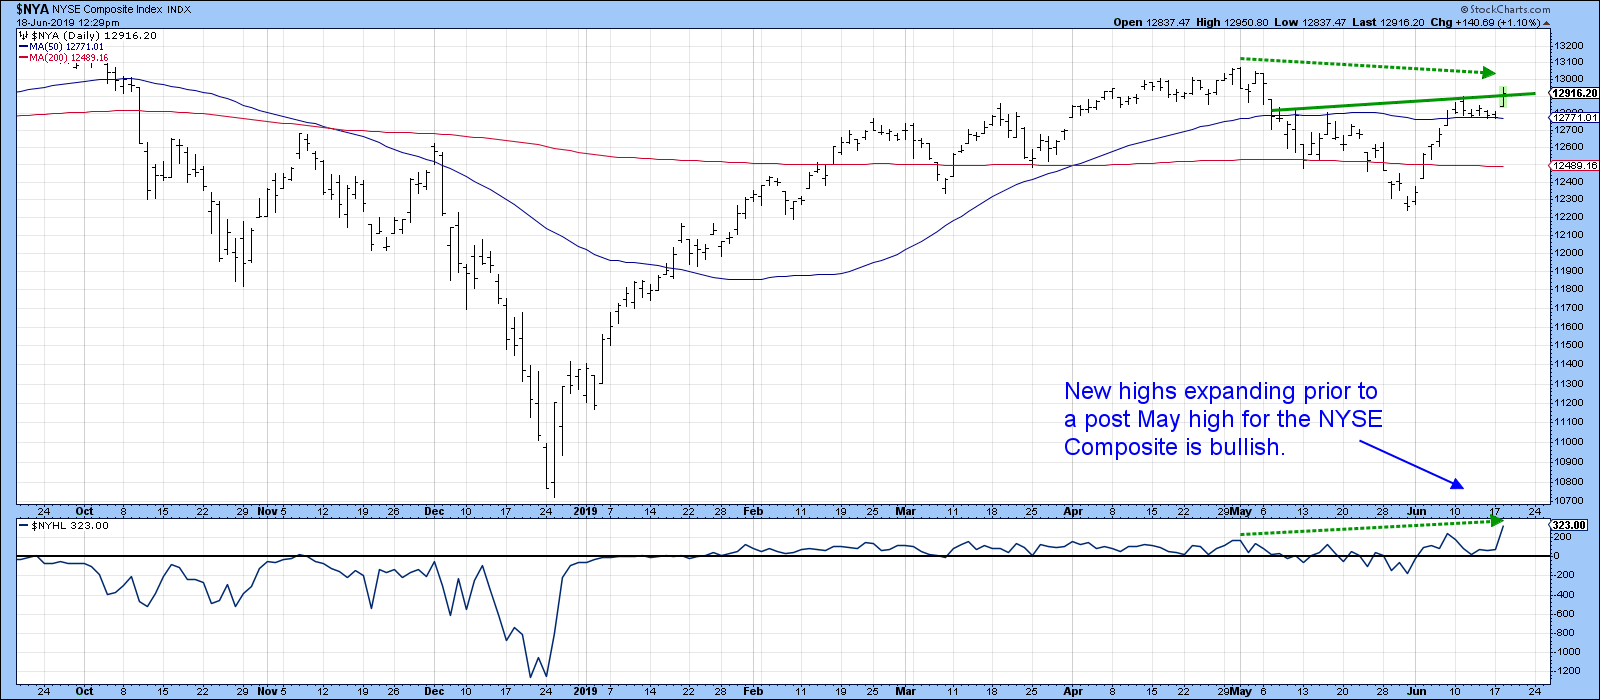
It’s always good to see new highs in an index being confirmed accompanied by an expanding new high list. Chart 7 shows that the current technical position is going one better than that, with the list expanding prior to the NYSE Composite registering a post-May high.
 Chart 7
Good luck and good charting,
Martin J. Pring
The views expressed in this article are those of the author and do not necessarily reflect the position or opinion of Pring Turner Capital Group of Walnut Creek or its affiliates.


