Has the slow and grinding uptrend in the US Dollar finally reached its exhaustion point? A quick review of the charts suggests this may be the case.
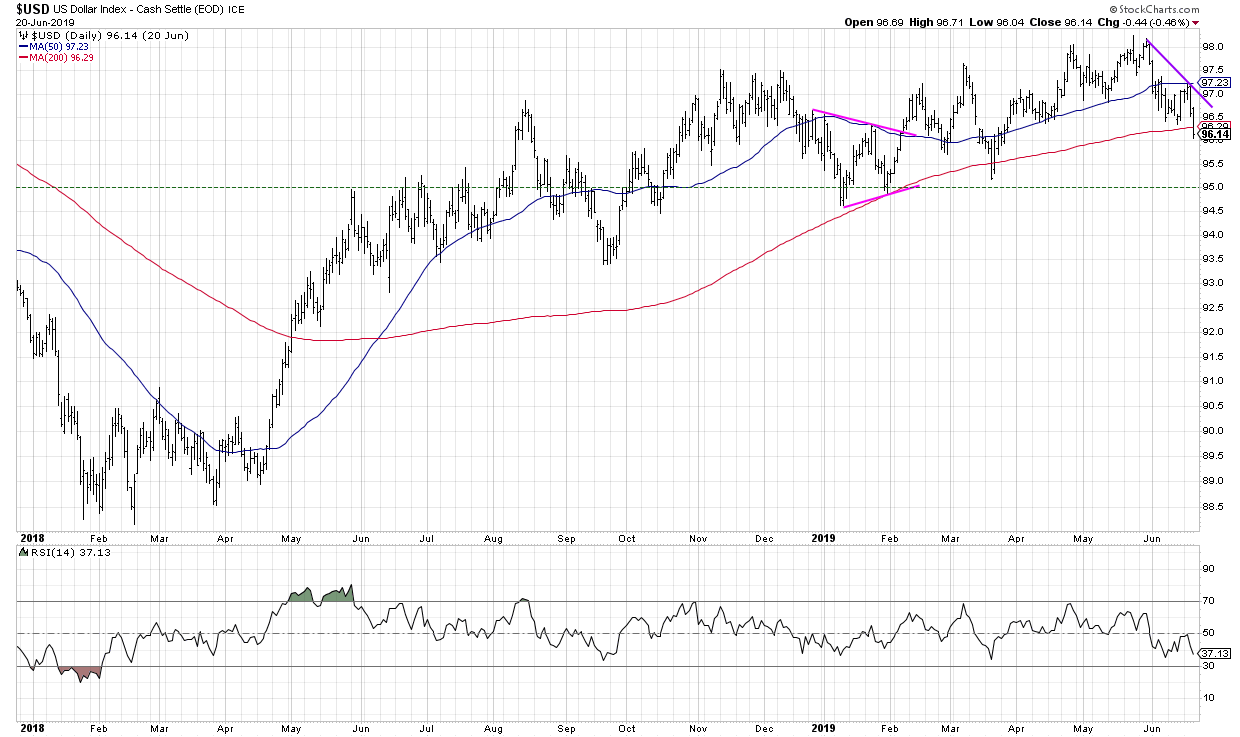 The $USD chart has certainly been a frustrating one for Dollar bulls, as the trend, while steadily positive, has not provided the upside follow-through you’d expect. Every time the Dollar index has approached the key 97.50 level, the greenback quickly reversed to find support around 94.50-95.00.
That all changed in late April, when the $USD finally reached 98 as it trended above two upward-sloping moving averages. All is well, right? Not so fast.
The US Dollar tested 98 three times in April and May, but was never able to go meaningfully higher. After that came a breakdown of the 50-day moving average, which often serves as support during brief price pullbacks.
This week, the Dollar established a lower high for the first time since April, before then breaking below its most recent swing low. That means that the Dollar is now in a Dow Theory downtrend of lower highs and lower lows.
Thursday and Friday also saw the Dollar index reach below the 200-day moving average. If this breakdown is confirmed next week, that would be the first time since April 2018 that the Dollar has remained below this key long-term barometer.
The Dollar Bullish ETF (UUP) is another way to track the rotation from bullish trend to bearish phase.
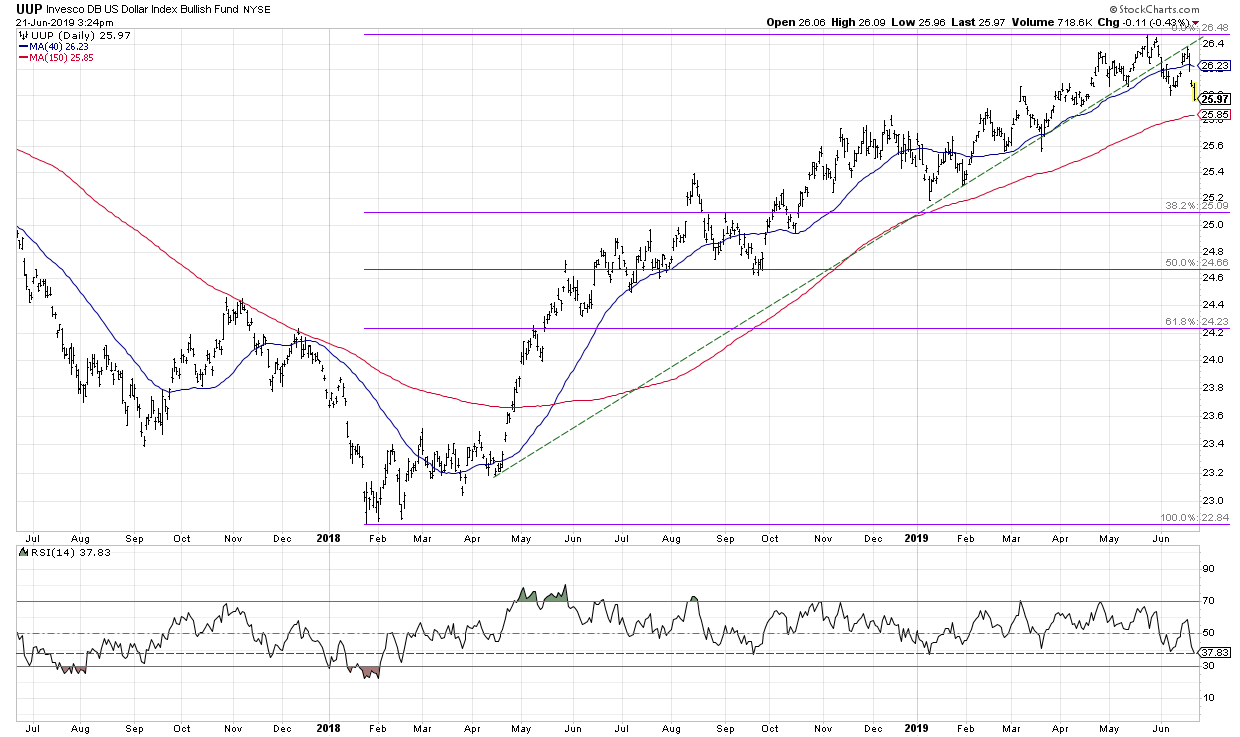 Here we see a significant trend line break that occurred in early June, where the price broke down through a trend line formed from the key lows in 2018 and 2019. The bounce last week pushed the price back up to that trend line before the Dollar resumed its downside push.
The RSI is important to watch here. Have you noticed how the last couple significant pullbacks in price have seen the RSI move down to around 40? A break of this RSI 40 level would suggest a rotation from a bullish phase to a bearish phase, with downside momentum increasing from previous selloffs.
So what’s next?
Well, the Dollar index has already broken the 200-day moving average, although the UUP has not yet done so. I’d look for the UUP to break down through this key trend mechanism to confirm further downside for the Dollar.
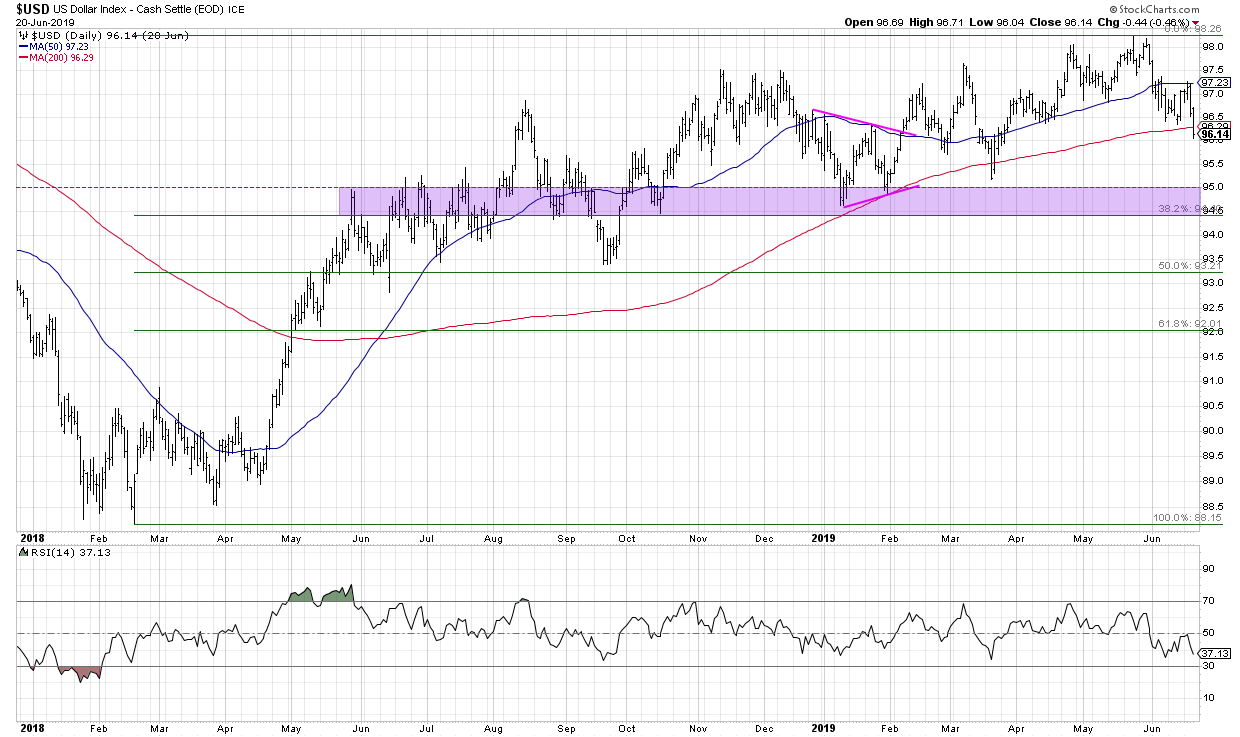 If this does occur, look to the 94.50-95.00 range on the US Dollar chart. That area has served as support a number of times so far this year and was an area of price congestion in 2018 as well. This would line up well with the first Fibonacci retracement level using the 2018-2019 Dollar rally.
RR#6,
Dave
David Keller, CMT
President, Sierra Alpha Research LLC
Disclaimer: This blog is for educational purposes only and should not be construed as financial advice. The ideas and strategies should never be used without first assessing your own personal and financial situation or without consulting a financial professional.
The author does not have a position in mentioned securities at the time of publication. Any opinions expressed herein are solely those of the author and do not in any way represent the views or opinions of any other person or entity.


