 Chartwise Women is a new show on StockCharts TV featuring myself and Mary Ellen McGonagle. Our mission is encompassed in three "E's": Engagement, Education and Empowerment. During each show, we talk conversationally about our "Wisdom of the Week", followed by "What's Cooking? From Data Farm to Table" and finishing up with one of our favorite segments, "Yeah...That Happened". (You have to watch to find out what happened!) If you would like to see our first few episodes, you can find them on the StockCharts YouTube Channel. There is a playlist for Chartwise Women available as well. We would absolutely love to have you join us live on Wednesdays at 3:00p EST on StockCharts TV.

Mary Ellen and I introduced the first piece of our Chartwise Women model/system last Wednesday. We decided that we wanted to create a visually appealing, simple-to-understand and successful model for beginning and experienced traders alike. Last Wednesday, we debuted the "Pink Line," which is actually a Chandelier Exit overlay that Dr. Alexander Elder has presented in his books and was developed by Charles Le Beau. For those who would like to "geek out" on the technicals, here is the link to ChartSchool that fully explains the formula and uses of Chandelier Exits.
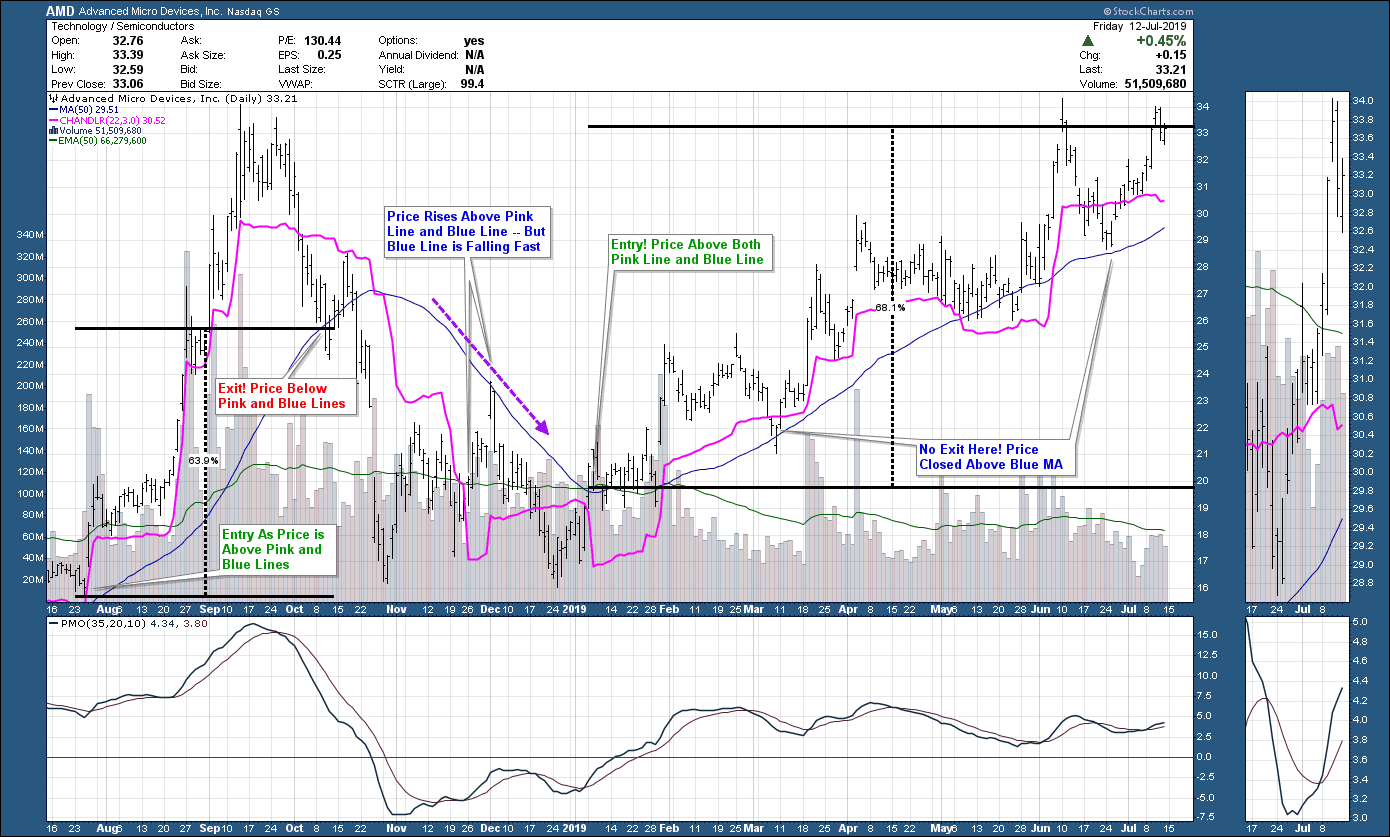
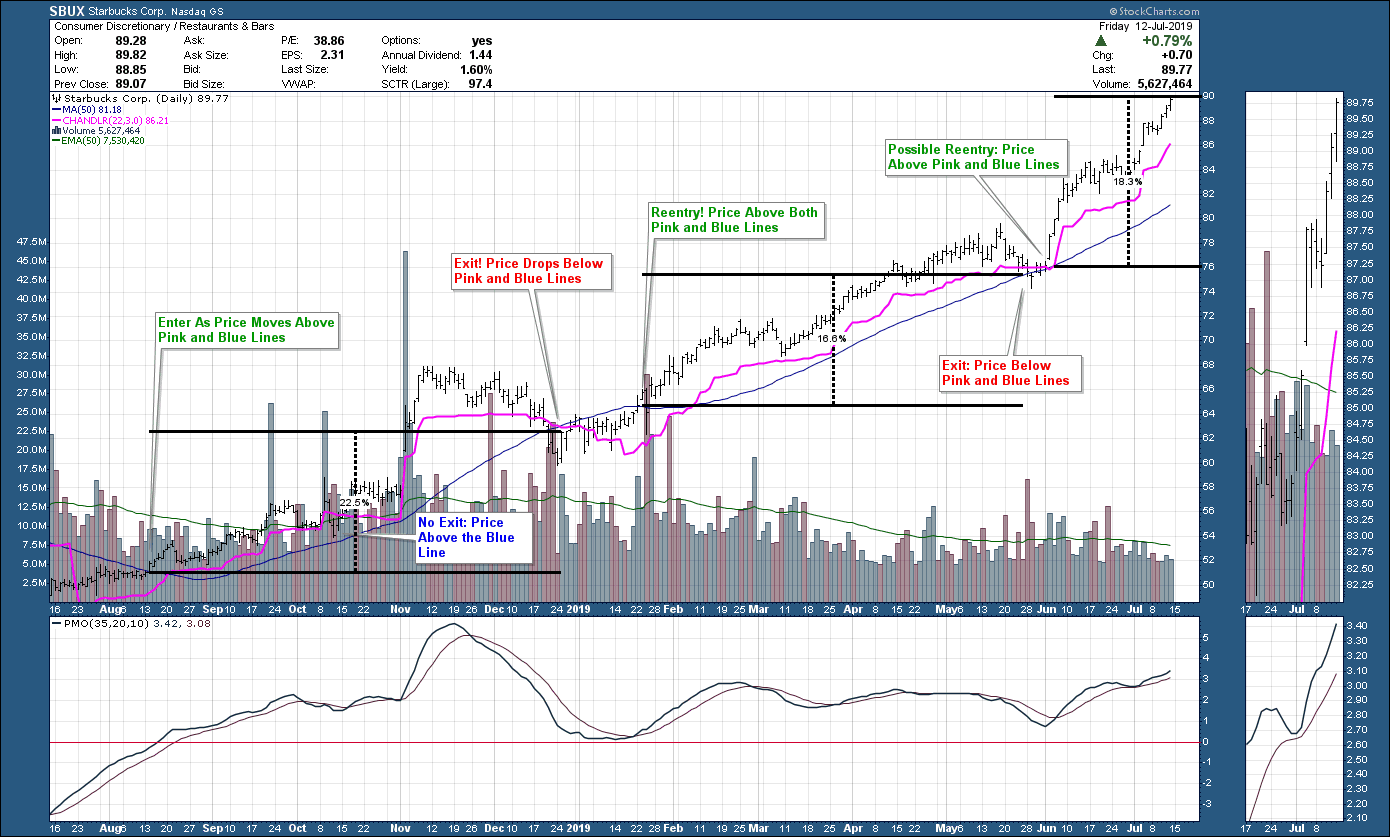
The "Pink Line" is a trailing stop overlay. When price is above the Pink Line, you're good to go on holding (or finding an entry). When price dips below, you will typically want to sell all or part of your position. The other elements of our model will be explained in future episodes, but the "Blue Line," which is a 50-MA, also plays a part. Using other indicators like momentum and volume will complete the model. For today, I want to show you some of the charts that incorporate the Pink and Blue Lines and show how they can be used for trading.
I have annotated the two charts below with entries and exits. The system, which uses just these two lines, is really quite simple. When price is above both the Pink and Blue Lines, that signals where you should enter. When it falls below, it's time to get out. Although, as we can see on AMD below, it didn't seem to work November/December. But, upon further inspection, you'll notice the Blue Line is falling fast. This means that price is trending lower very quickly--not a good time for an entry. If we are patient, we get an excellent entry when price crosses above both lines in January, which is even confirmed by an upswing and crossover on momentum. How to avoid exiting too early? Price fell below the pink line, but was still closing above the Blue Line. You would still be holding AMD right now based on this system with a 68% gain.
 The Starbucks (SBUX) chart below shows a Blue Line that is rising throughout. Our entries and exits will likely be good. Looking at our three trades, they made 22.5%, 16.6% and still holding on an 18.3% gain.
 Conclusion: The Pink Line, or Chandelier Exit, helps us to get in and get out. When we add the Blue Line or 50-MA, the system is refined and we are able to avoid getting stopped out or entering in a downtrend. I look forward to talking to you again on Wednesday at 3:00p EST with Mary Ellen McGonagle about the Pink and Blue Lines!
Technical Analysis is a windsock, not a crystal ball.
Happy Charting!
- Erin
erinh@stockcharts.com
Helpful DecisionPoint Links:
DecisionPoint Shared ChartList and DecisionPoint Chart Gallery
Price Momentum Oscillator (PMO)
Swenlin Trading Oscillators (STO-B and STO-V)
**Don't miss DecisionPoint Commentary! Add your email below to be notified of new updates"**
