Price action is not everything, it's the only thing. This is what Vince Lombardi might have said were he a trader or investor. Indicators are great for scans and sorting through hundreds of stocks, but nothing takes the place of price action. Moreover, our profits and losses are based on price values, not indicator values.
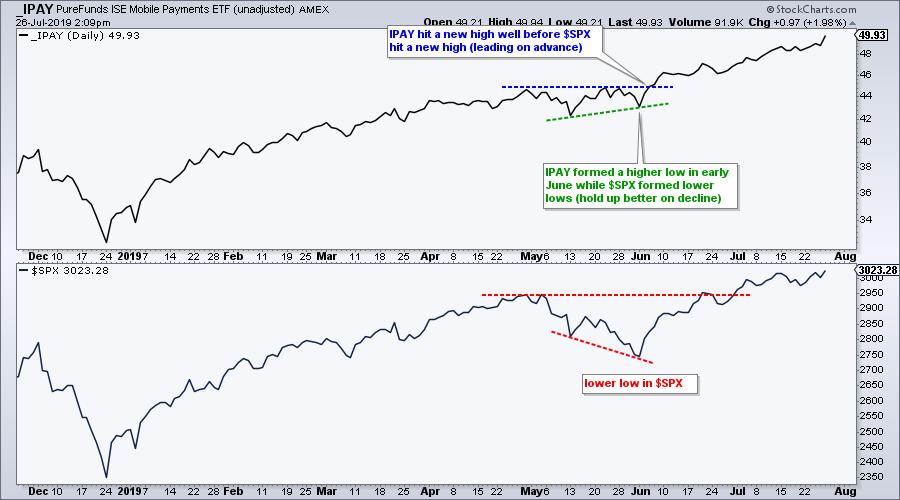
At the risk of stating the obvious, bullish price action occurs when a stock records higher highs and higher lows. Bearish price action is when price a stock records lower lows and lower highs. Chartists can compare a stock's highs and lows against those of a market benchmark to find stocks showing relative "chart" strength. When SPY is forming a lower low, chartists should look for stocks that are NOT forming lower lows. These stocks are holding up better than the market and often lead when the market turns back up. Let's look at an example.
The next chart shows a peak-trough example using SPY and Workday (WDAY). First, we should all have an idea of recent peaks and troughs in SPY or the S&P 500, even without looking at the chart. At the time, we all knew that SPY moved well below its October-November low in December. WDAY, on the other hand, formed a higher lower in November and even broke out to a 52-week high in December. The stock held up better on the way down and hit a new high well before SPY. Talk about a leader!
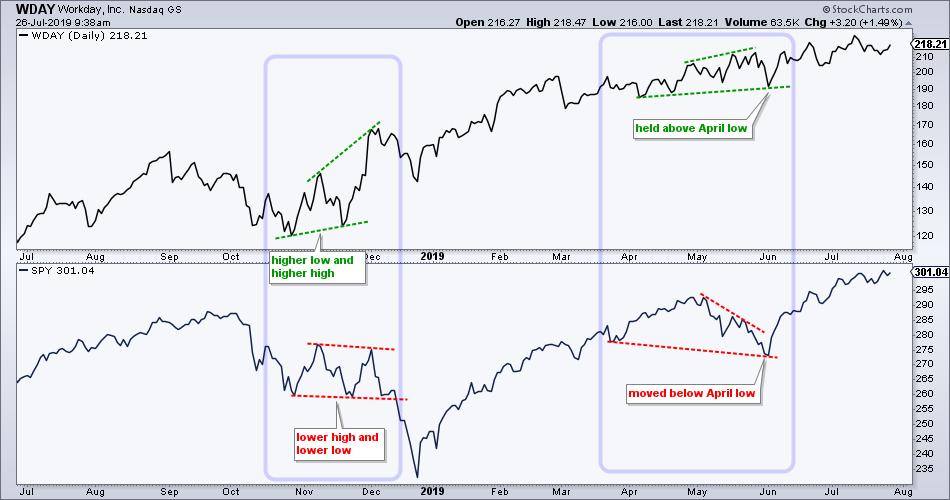
Workday also held up better than SPY in May-June. Notice that SPY moved below its April lows with the May decline, but WDAY held above the April lows. In addition, WDAY hit a new high on June 10th, ten days before SPY hit a new high. As far as the price chart is concerned, WDAY held up better during broad market weakness and performed better when the market rebound.
State of Stock Market Video
- Index and Sector Breadth Tables Bullish
- New Signal from Mid-Cap %Above 200-day EMA
- Breadth and Price Charts for XLI, XLV and XLF
- Leading ETFs Making New Highs in July
- Reversal Alert Zones (RAZ's) in IBB and XBI
Choose a Strategy, Develop a Plan and Follow a Process
Arthur Hill, CMT
Chief Technical Strategist, TrendInvestorPro.com
Author, Define the Trend and Trade the Trend
Want to stay up to date with Arthur's latest market insights?
– Follow @ArthurHill on Twitter


