Editor's Note: This article was originally published in Martin Pring's Market Roundup on Tuesday, July 30th at 1:14pm ET.
Technical Analysis is an art form, one in which we put together several reasonably reliable indicators and form a weight-of-the-evidence opinion about the status of the current trend. Sometimes it makes sense to bypass that approach temporarily and instead do a two-way test for the primary trend.
My approach to this is to see whether the market in question is experiencing a positive smoothed long-term momentum. Personally, I use the KST, but any similar measure of momentum (e.g. Coppock Curve, MACD, stochastic), using the 24,15,10 parameters (or something similar) on monthly data, would do. The main thing is to make sure the indicator you are using has been reasonably accurate in the past. (I say "reasonably" accurate, because we are never going to find a perfect one.)
The second part of the test is to see where the market we are following is relative to its 12-month MA. This is by no means a perfect timespan, but it does seem to work reasonably well. Using 12 months, for example, certainly eliminates any seasonal problems. Once the quick test has been applied, it's up to the rest of the technical toolbox to prove otherwise.
Applying our two-way test to the US Dollar Index, we can see it has been in a primary bull market since early 2018. We have to be a bit careful with that statement, though, because late June saw the Index just edge below its MA. At no point, though, was the series of short-term rising peaks and troughs, in force since 2018, reversed. July saw the Index rebound. If you look very carefully you can see that the KST started to re-accelerate in July, a positive sign.
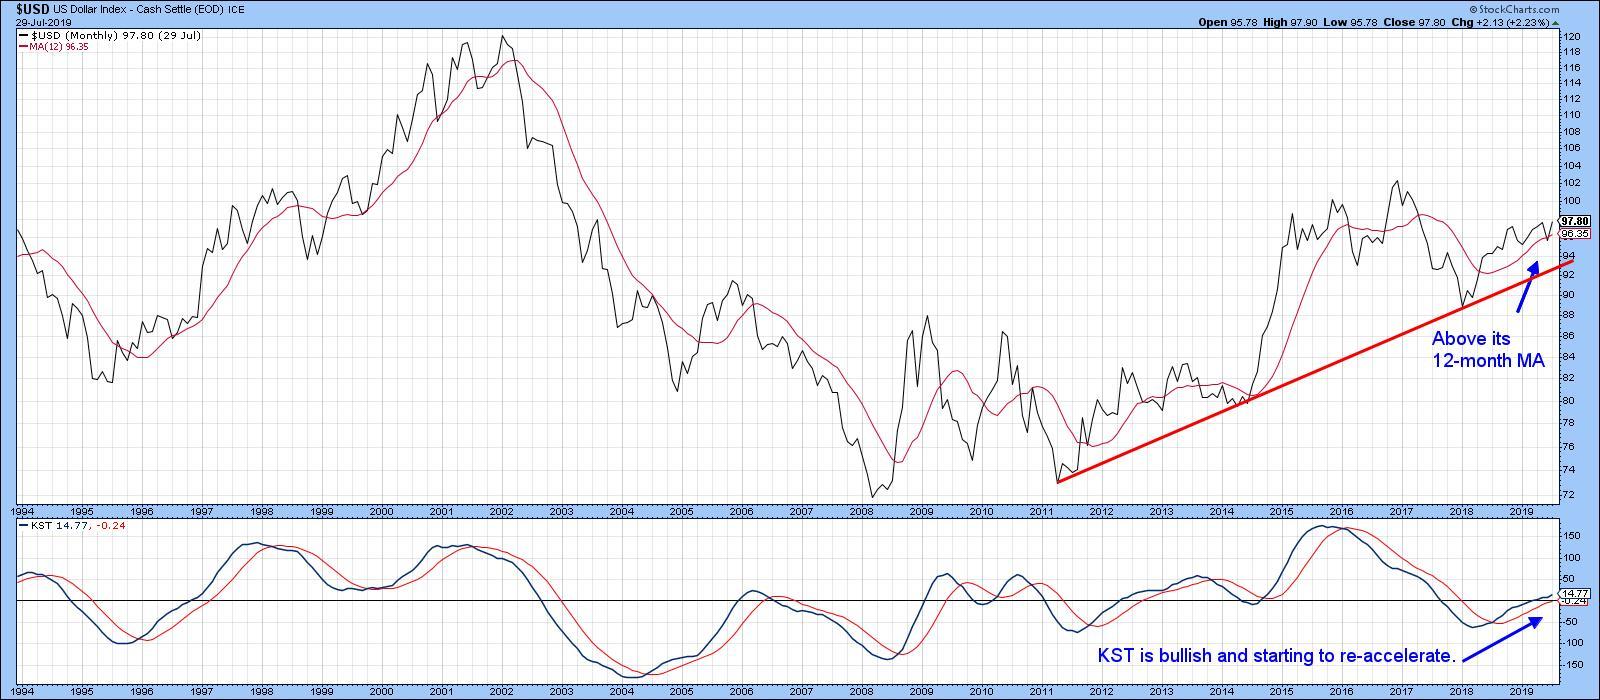
Chart 1
Chart 2 compares the Index to its Special K indicator, which you can read about here. Most of the time, this indicator peaks and troughs with the price series it is monitoring, which is easy to spot with the benefit of hindsight. That means that we need to apply trend reversal techniques to confirm when the Special K (SPK) has turned on a primary trend basis.
Because of the SPK's jagged nature, trend line violations are probably the most practical and accurate technique to apply. Another technique would be to incorporate signal line crossovers. The signal line is calculated as a 100-day MA of a 100-day MA. The SPK violated its 2015-19 downtrend line in the spring and has managed to remain above its signal line since the spring of 2018. Since the series of rising SPK peaks and troughs is still intact, it is easy to conclude that the SPK is in a bullish trend.
The Index dropped below its red uptrend line and 200-day MA in June, but has since rebounded. Usually, false breaks of this nature are bullish because traders betting on a decline are forced to get in line with the new upward price trend. Obviously, the next challenge lies at the green line, around 98. A move above that would be very bullish.
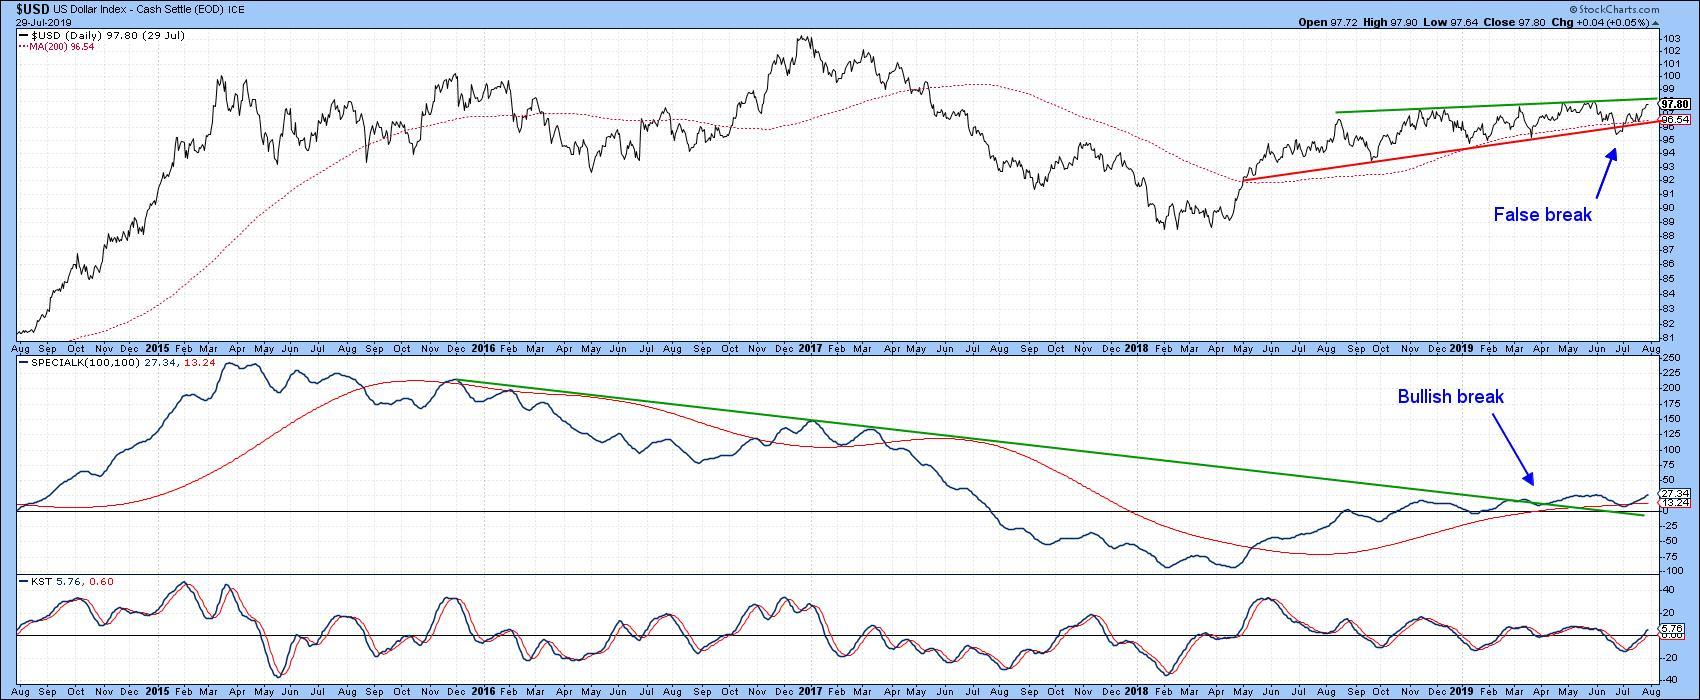
Chart 2
The WisdomTree US Dollar Bullish Fund ETF (USDU) is far more thinly traded than the Dollar Index. However, the Index has a 57% euro weighting, which means that the USDU offers a more broadly-based view of what's really happening with the dollar. Note that it has held above its 200-day MA for some time, unlike the Index itself. Currently, the USDU is threatening its May high, but with all three KSTs in a bullish mode, it seems likely to move higher.
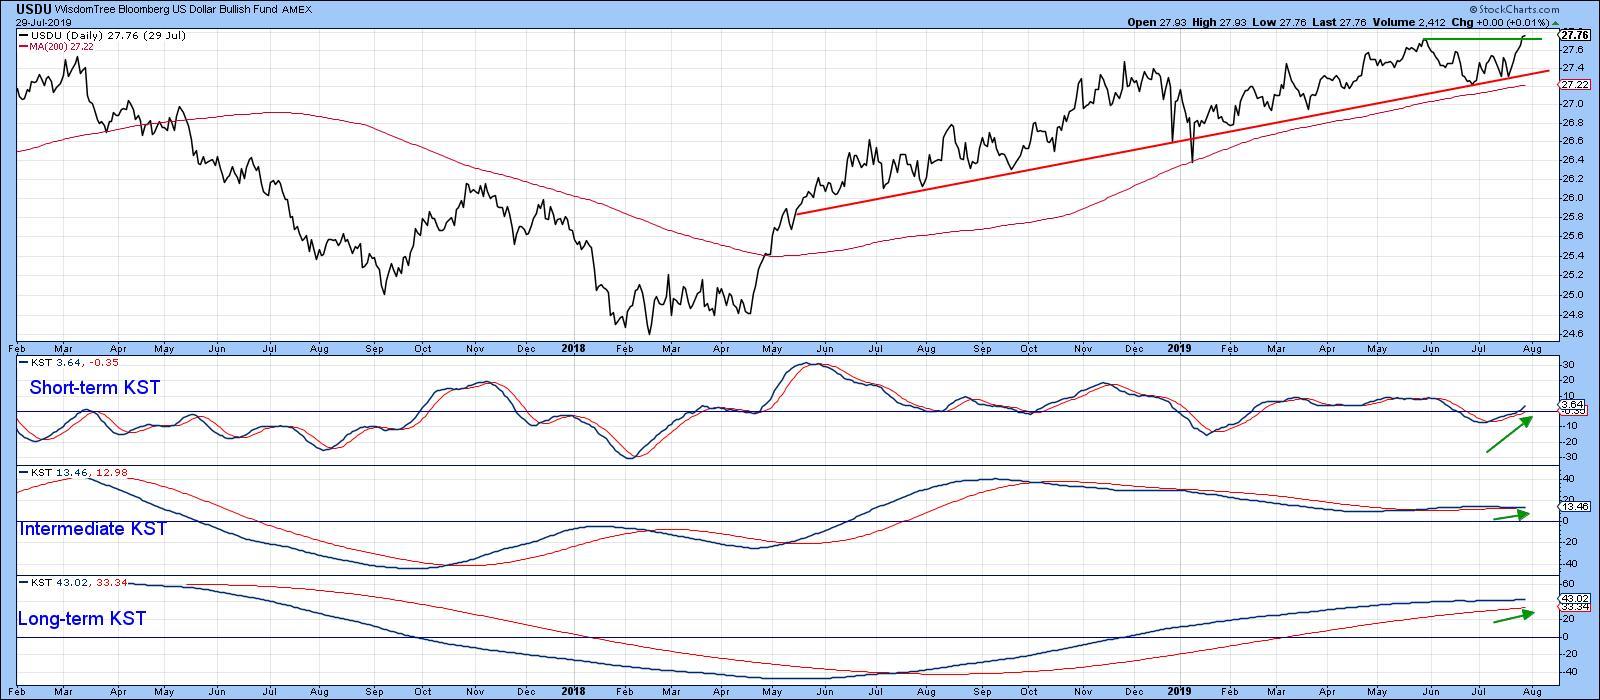
Chart 3
Good luck and good charting,
Martin J. Pring
The views expressed in this article are those of the author and do not necessarily reflect the position or opinion of Pring Turner Capital Group of Walnut Creek or its affiliates.


