"Never confuse brains with a bull market."
When the market is going higher and the average stock is appreciating, we often attribute the gains to our skill as investors. Due to our incredible investing prowess, we have managed to own stocks that are doing well!
However, when the uptrend starts to reverse, we often attribute those losses to forces outside of our control. It's the market just moving against you, or even just plain bad luck.
Market uptrends are easy. Market downtrends are when bad habits and inconsistencies in your investment process can start to have a real drag on your performance. Having said that, here are three charts that I would argue should cause you to review your portfolio with a more cautious perspective.
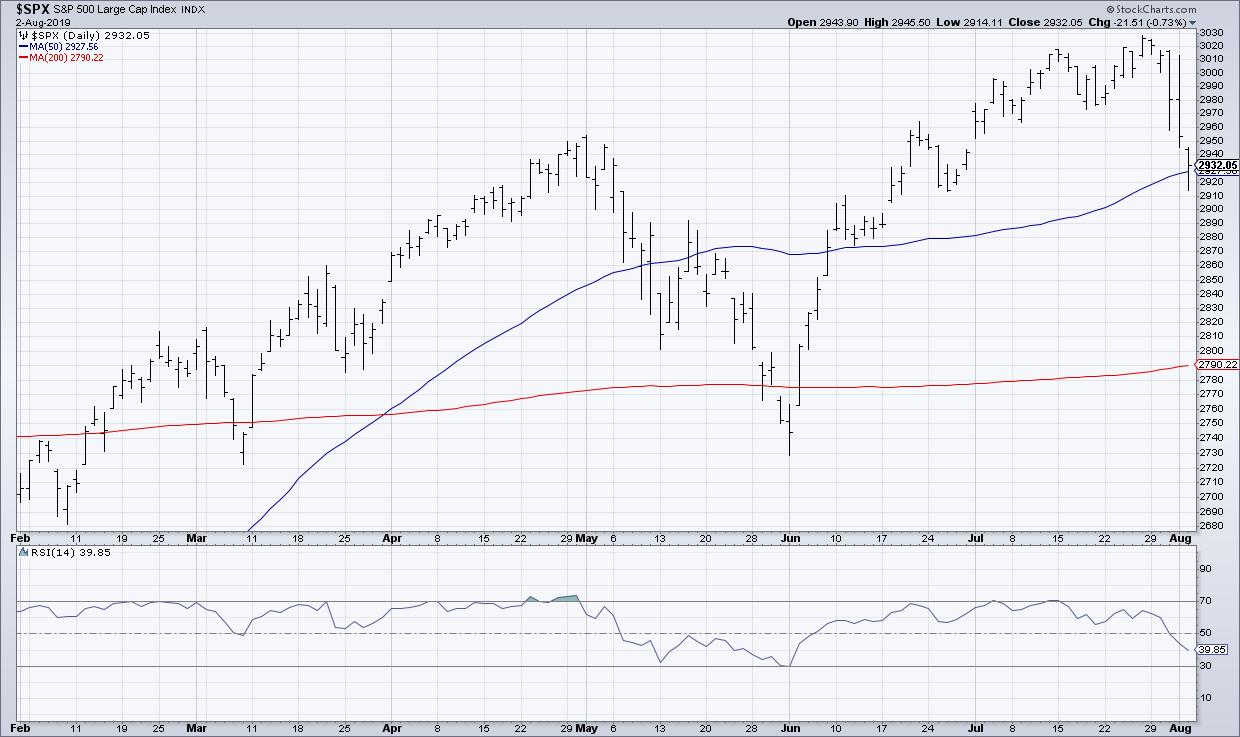
First, the S&P 500's Friday low lined up with the low from the end of June, as well as a 38.2% Fibonacci retracement from June-July 2019. This confluence of support levels suggests a potential short-term bottom as the market digests this week's losses.
The index also closed above the 50-day moving average after trading below during the day. While this would suggest a short-term bounce next week, I think the fact that we closed below the open confirms the fact that expectations are weakening every trading day.
Finally, we have a bearish divergence with price and RSI. As the S&P has made higher highs in the last three weeks, the RSI has confirmed lower highs. This represents a weakening of momentum leading into the most recent high and suggests further weakness in the coming weeks.
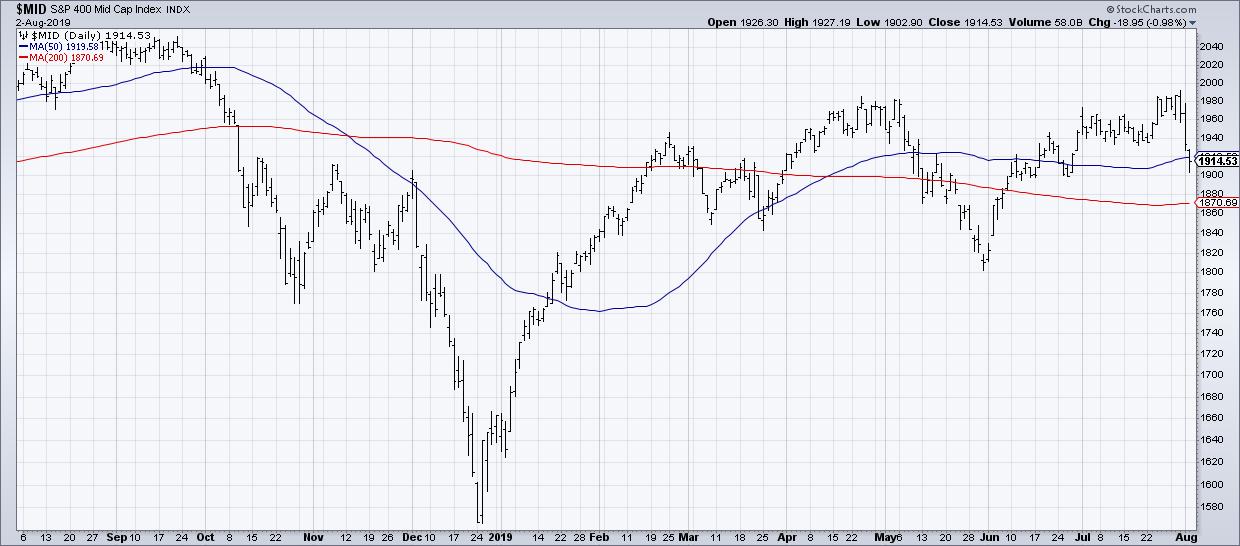
Second, one of the key themes I've been tracking is the relative weakness of mid-cap and small-cap stocks relative to large-caps. As the S&P 500 has made higher highs in July, the mid-cap index found resistance around the 1985 level. The inability of mid-caps to confirm the upside in large-caps suggests weaker breadth than you'd want to see in bull market phases.
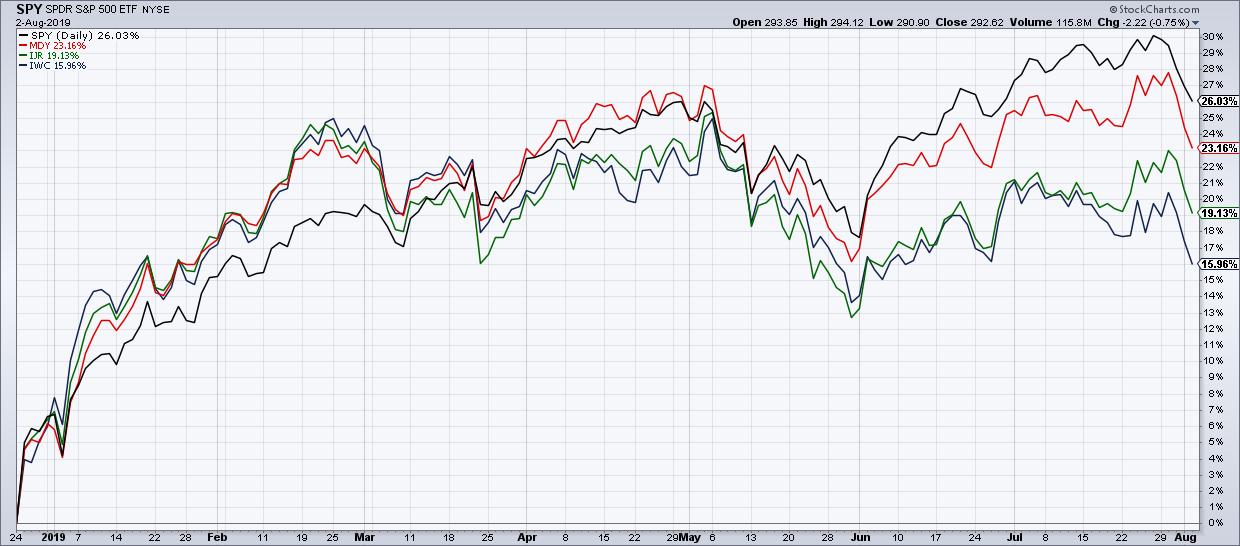
When you compare all the cap tier indexes, you'll notice that while the S&P has confirmed higher highs, all the others have struggled to do so. The micro-cap index has even broken to a new swing low after selling off through Friday's trading session. I'd want to see much stronger charts from mid-cap, small-cap and micro-cap stocks if I was looking for further upside for equities as a whole.
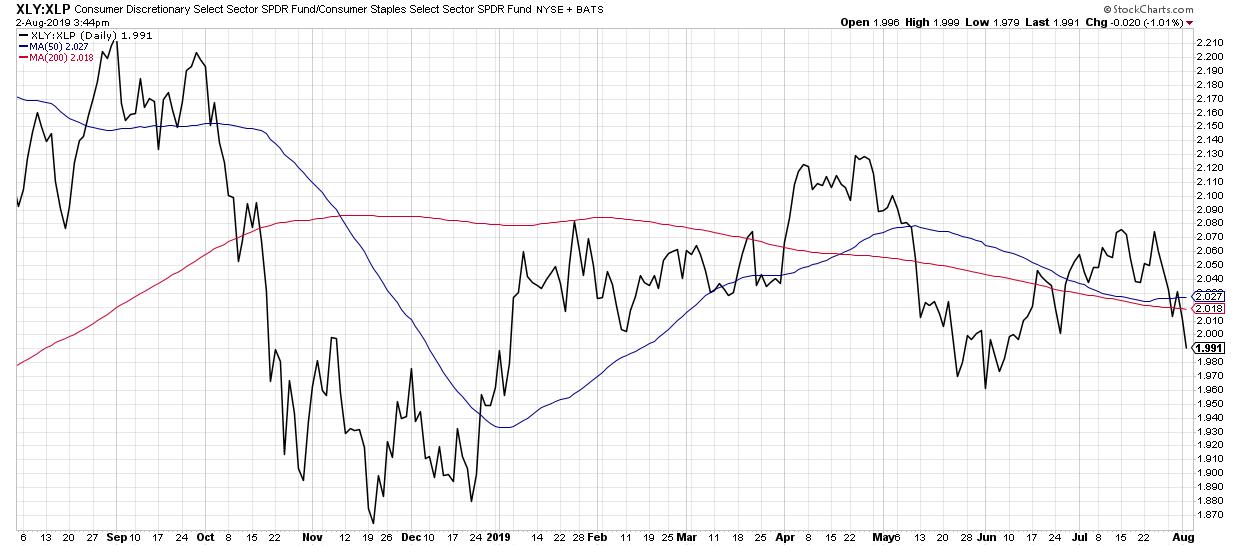
Finally, we have one of my favorite measures of offense vs. defense in the form of the Consumer Discretionary-to-Consumer Staples ratio. This ratio is a good way to track flows between traditionally offensive and defensive portions of the consumer space. The ratio moved higher through much of June and July, but started to turn lower this week. This suggests that investors are rotating to a more defensive posture, which would indicate potential further weakness going forward.
This summer has so far seen a resilient bull market during a traditionally strong part of the trading calendar. These bearish indications warn of a potential rotation to a bearish phase leading into the fall, when most market bottoms have indeed occurred.
Regardless of what the coming months hold, right now is an excellent time to review your portfolio for potential downside risks and plan accordingly!
RR#6,
Dave
David Keller, CMT
President, Sierra Alpha Research LLC
