One thing that we technical analysts like to spot at price tops is an indicator flashing a negative divergence, which is an indicator that is trending downward while price continues to trend upward. Such divergences imply that internals are eroding under the rising price, and that a price correction could be next. However, negative divergences in a bull market frequently display cyclical internal weakness that doesn't manifest itself in price movement. This is particularly true of indirect indicators like the PMO, ITBM, ITVM, stochastics, RSI, etc., so I recently asked myself if there wasn't an indicator that gives us a direct, understandable result in which we could have higher confidence, and I ended up at the Percent of SPX Stocks Above Their 20EMA chart.
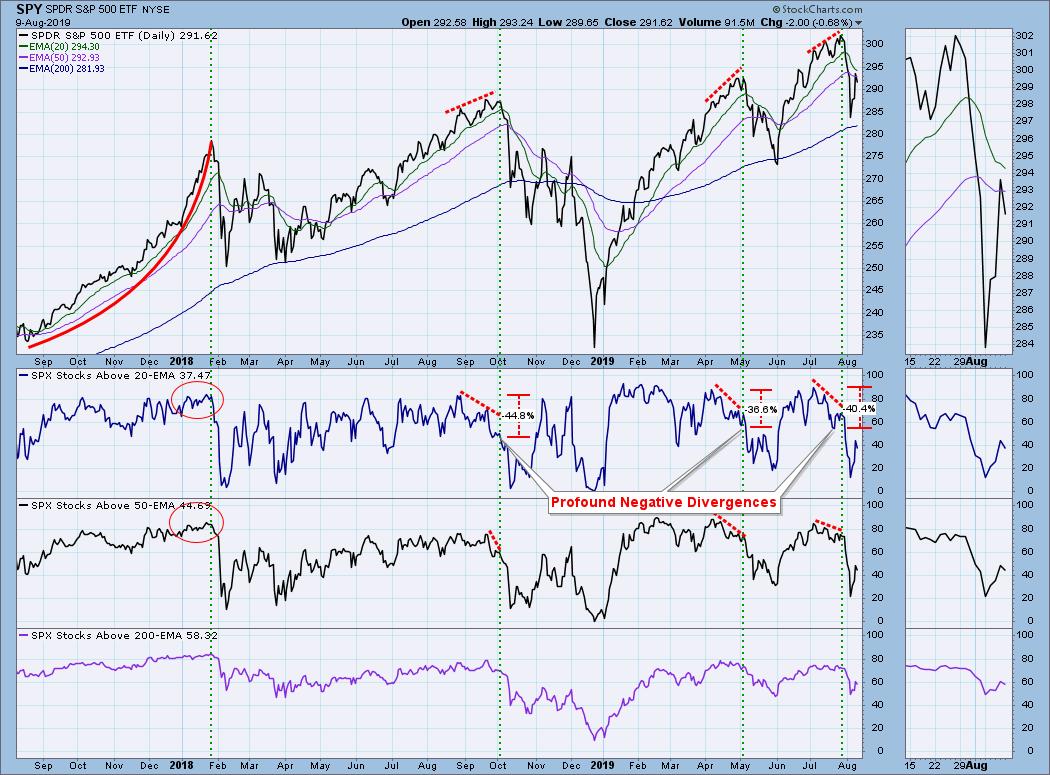
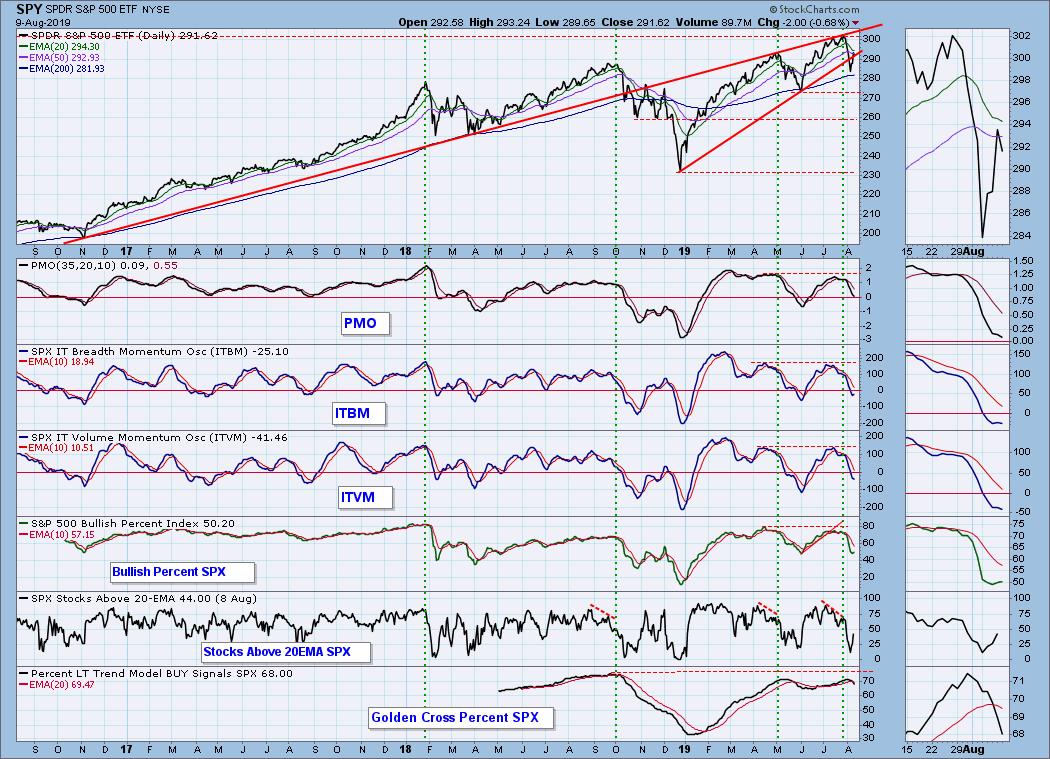
When a stock drops below its 20EMA, it is a sign of short-term weakness, and it is no longer participating in the market advance. At each of the market tops in October 2018, May 2019, and August 2019 (three times within a year) the indicator showed profound negative divergences as the market was making new, all-time highs. By "profound" I mean that in these cases the percent of stocks above their 20EMA dropped by as much as -45%. Think of it. Forty-five percent of the stocks participating in an advance take a coffee break. This is something I'm going to pay attention to from now on.
Finally, take note of the indicator behavior associated with the January 2018 market top -- there was no negative divergence at all. There is no mystery here. That was a broad-based parabolic advance which stretched prices well above their 20EMAs, and it was not likely that we would see a negative divergence in this case.
The DecisionPoint Weekly Wrap presents an end-of-week assessment of the trend and condition of the stock market (S&P 500), the U.S. Dollar, Gold, Crude Oil, and Bonds.
Watch the latest episode of DecisionPoint on StockCharts TV's YouTube channel here!
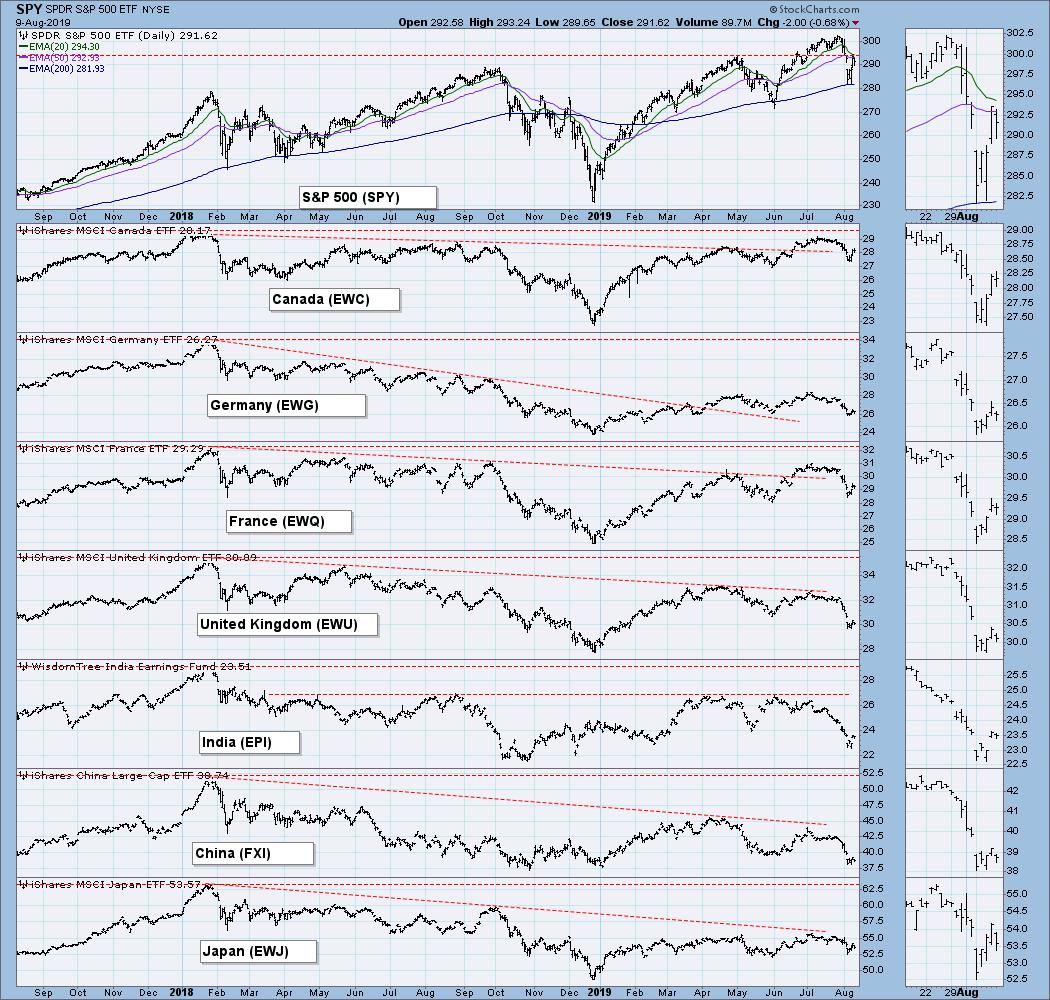
GLOBAL MARKETS
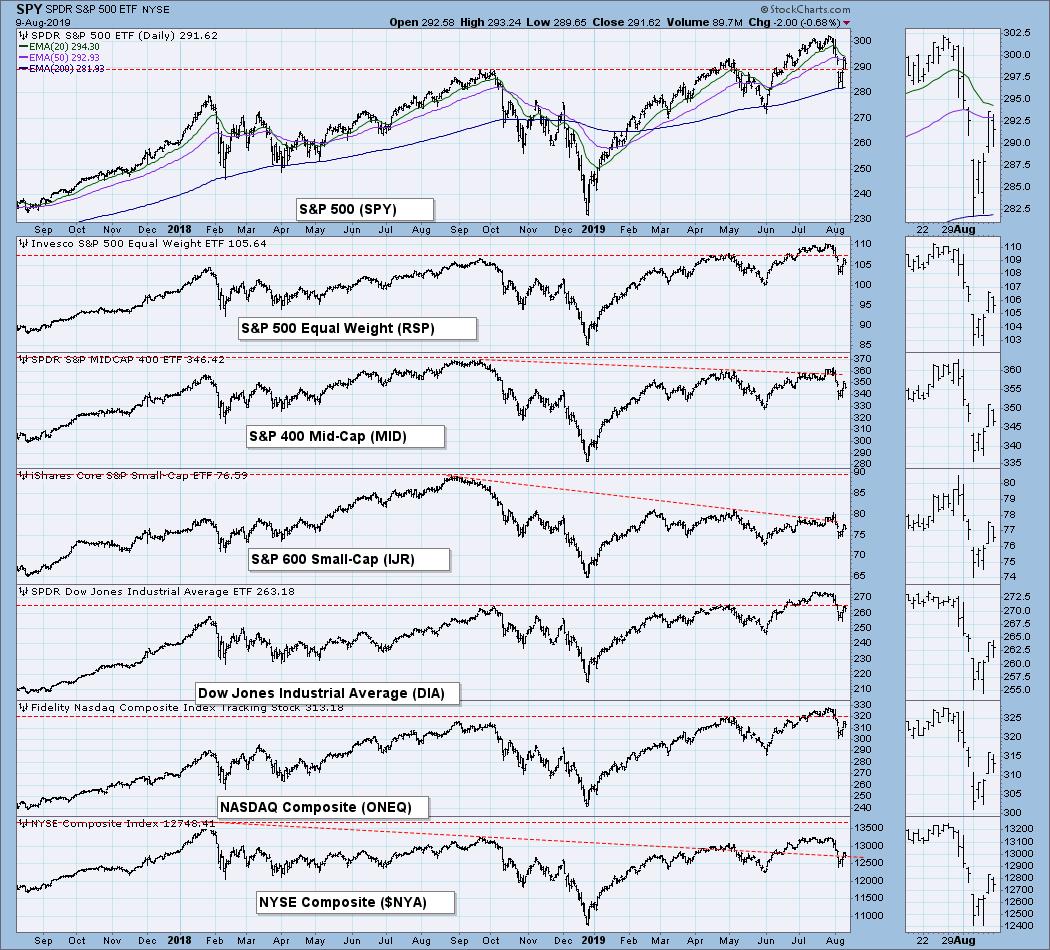
BROAD MARKET INDEXES
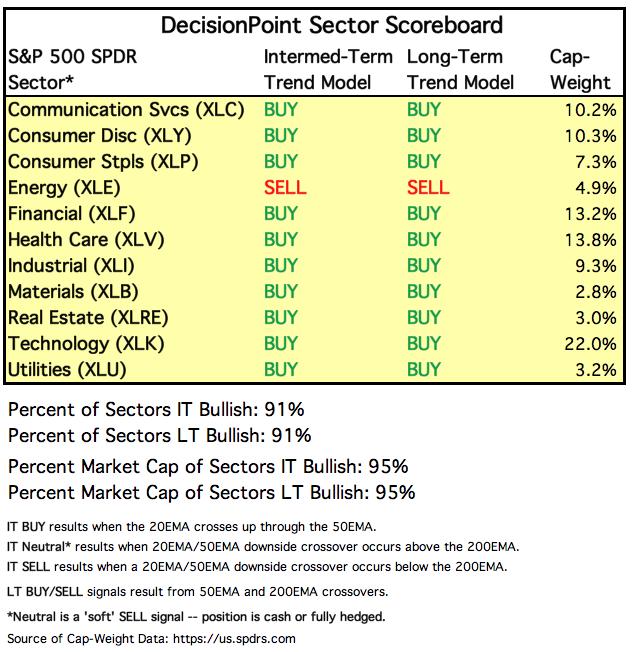
SECTORS
Each S&P 500 Index component stock is assigned to one, and only one, of 11 major sectors. This is a snapshot of the Intermediate-Term and Long-Term Trend Model signal status for those sectors.
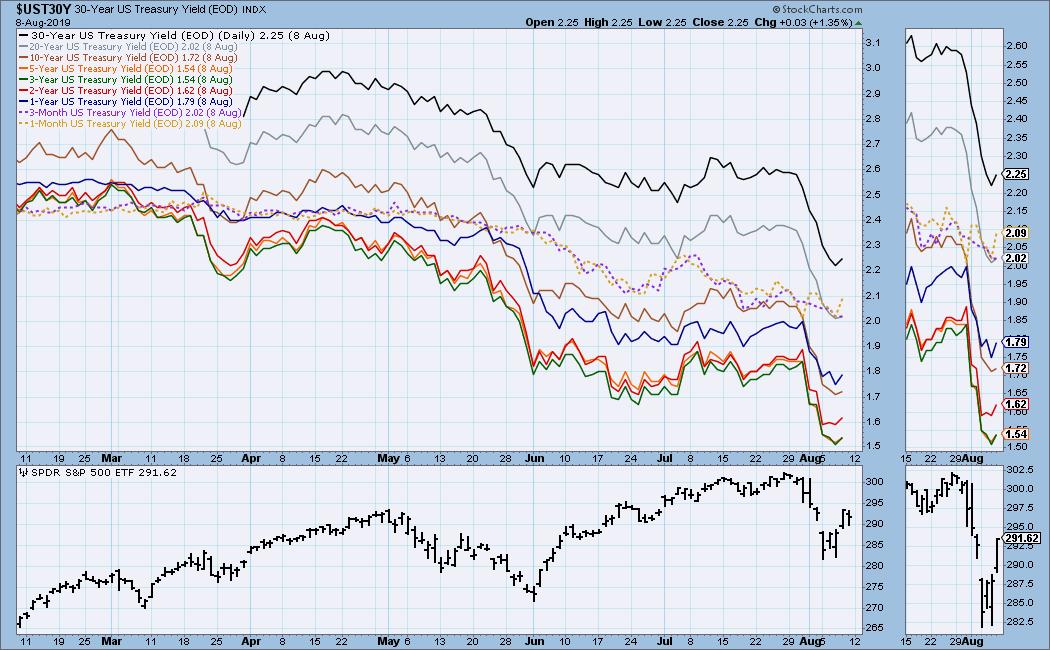
INTEREST RATES
Because some interest rates are currently inverted, I will be including a chart so we can monitor the situation. In normal circumstances the longer money is borrowed the higher the interest rate that must be paid. When rates are inverted, the reverse is true. It is generally believed that rate inversions result from "a flight to safety." On the chart below, notice that the one-month and three month T-Bills (dotted lines) pay a higher interest rate than the one year through the 10-year T-Bonds. This is a problem for the stock market.
STOCKS
IT Trend Model: BUY as of 6/11/2019
LT Trend Model: BUY as of 2/26/2019
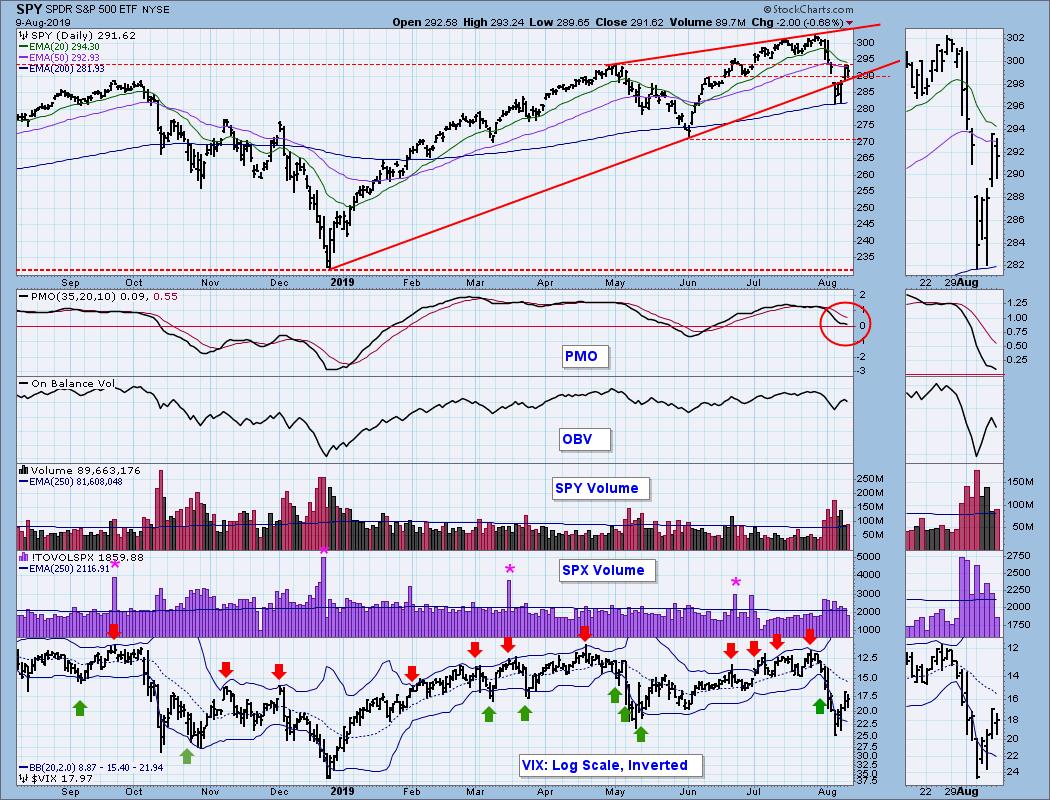
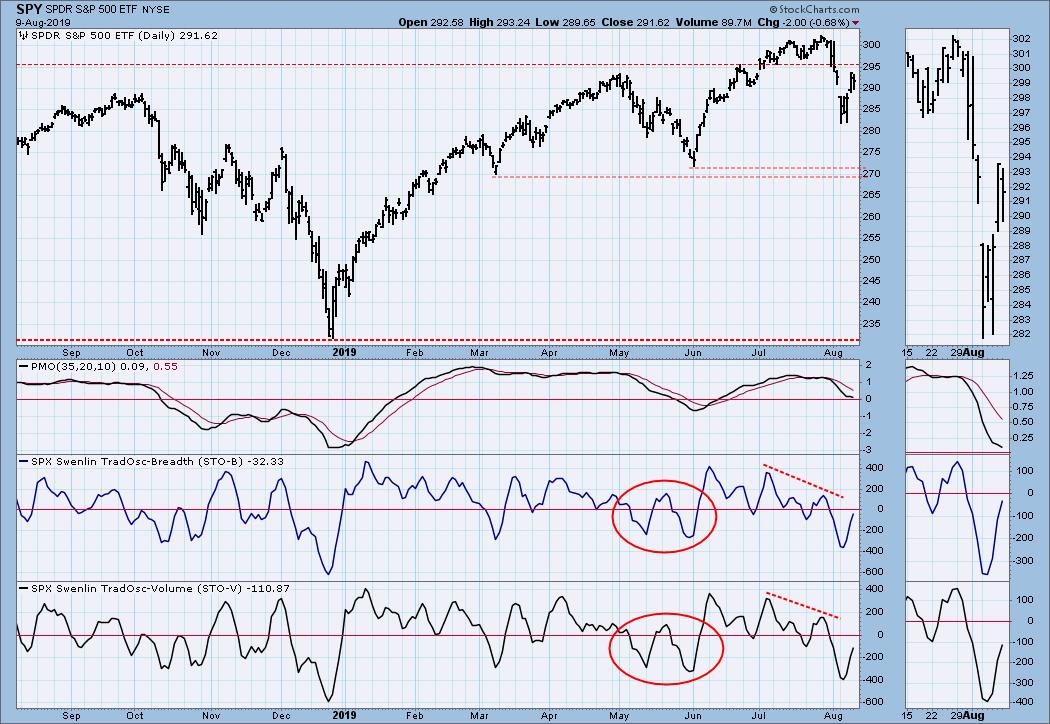
SPY Daily Chart: The big rising wedge resolved downward this week, but then it was recaptured. The VIX got quite oversold, and now I'm wondering we will have a repeat of market action in May, where the market will take out this week's lows and finish the decline with another spike bottom.
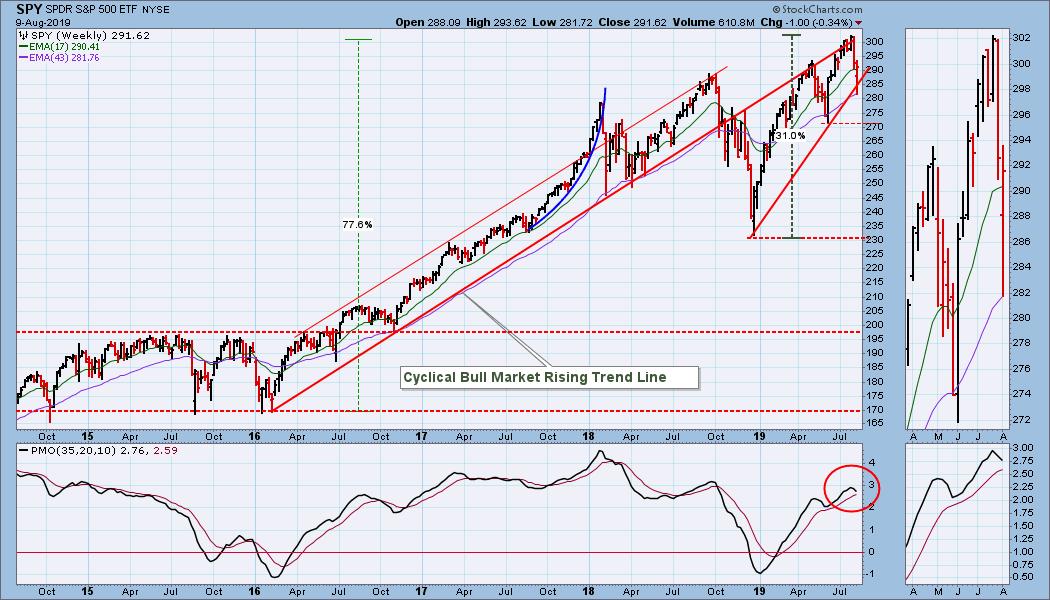
SPY Weekly Chart: This chart is slightly bearish because the weekly PMO has topped again.
Climactic Market Indicators: Thursday was a climax day, but I'm hard put to decide if it was an initiation or an exhaustion. There were very high levels of net breadth and net volume. Even new highs broke the contracting tops line drawn from early June. Total SPX volume was solid, but I thought it was somewhat less than that huge price advance deserved.
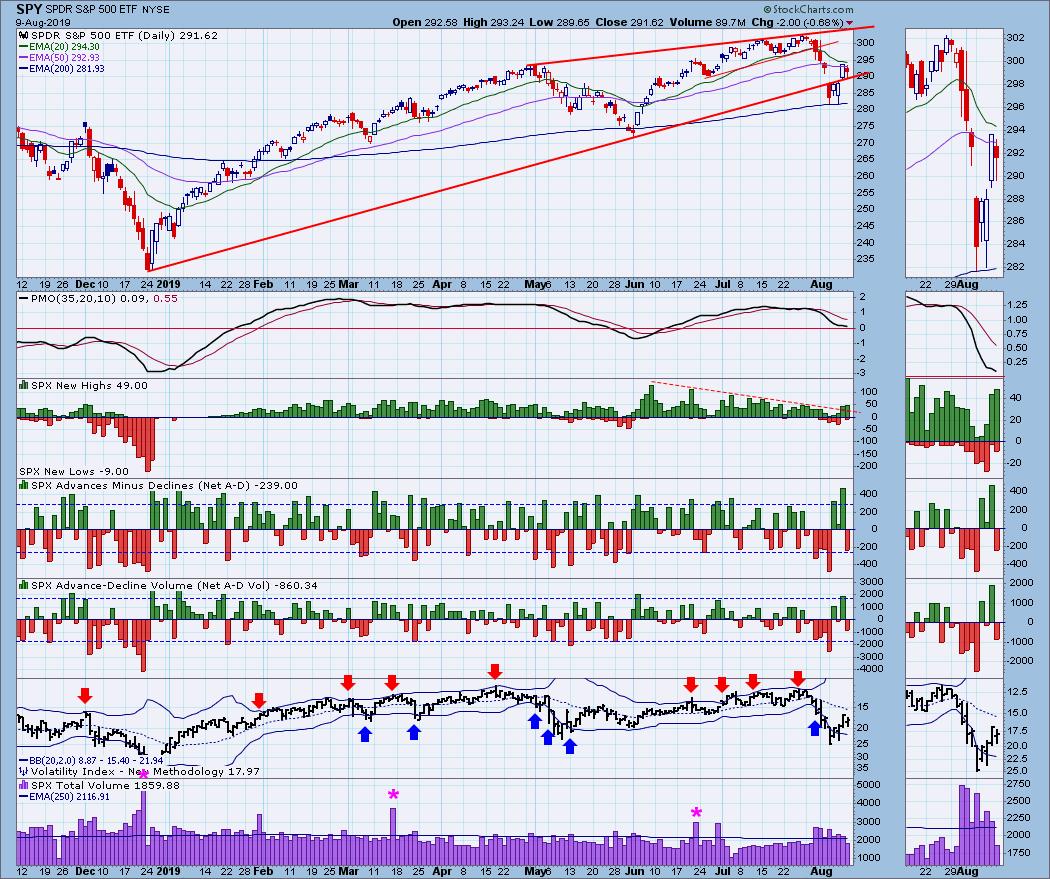
Short-Term Market Indicators: I am thinking that we are in the process of copying May's market action, and that when the current bounce is over, the market will head down for a lower low, and the STO-B and STO-V will form a second bottom.
Intermediate-Term Market Indicators: I have added the Stocks Above 20EMA chart to this set of indicators. It may be some time before it has another important negative divergence, but I want to keep an eye on it. The top four indicators have reached a level that has proven to be oversold for most of the period shown on the chart, and they seem to be struggling to turn up.
CONCLUSION: It appeared to me that markets became momentarily disconnected and unstable early this week. There was a different feel, as if panic had set in, but that soon passed once the selling dried up on Wednesday. As for what might happen next, I'm using May as a road map, meaning I'll be looking for another leg down to a low below this week's low.
Next week is options expiration week, so I will be looking for low volatility toward the end of the week.
DOLLAR (UUP)
IT Trend Model: BUY as of 7/5/2019
LT Trend Model: BUY as of 5/25/2018
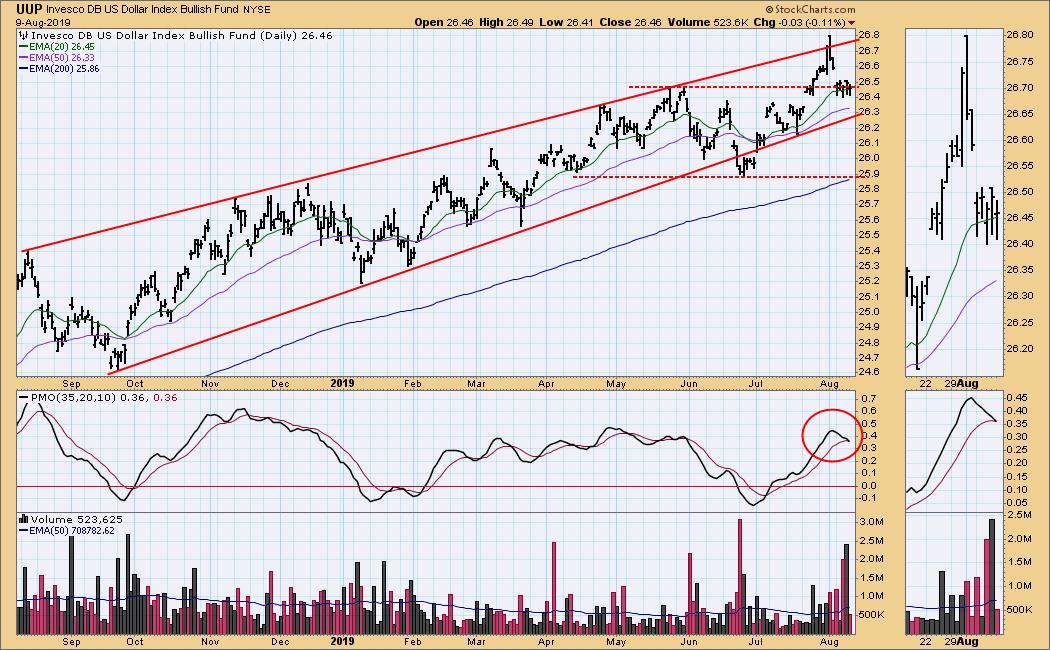
UUP Daily Chart: Whereas, last week the dollar made a sharp advance, this week it pulled back and consolidated.
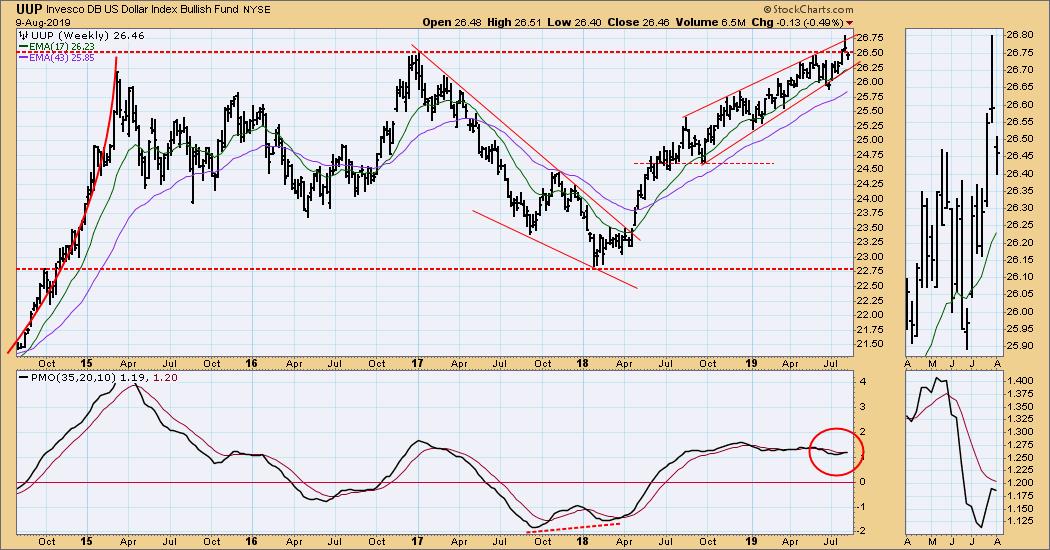
UUP Weekly Chart: In this time frame we can see the long-term line of resistance, which, incidentally, goes back to 2008.
GOLD
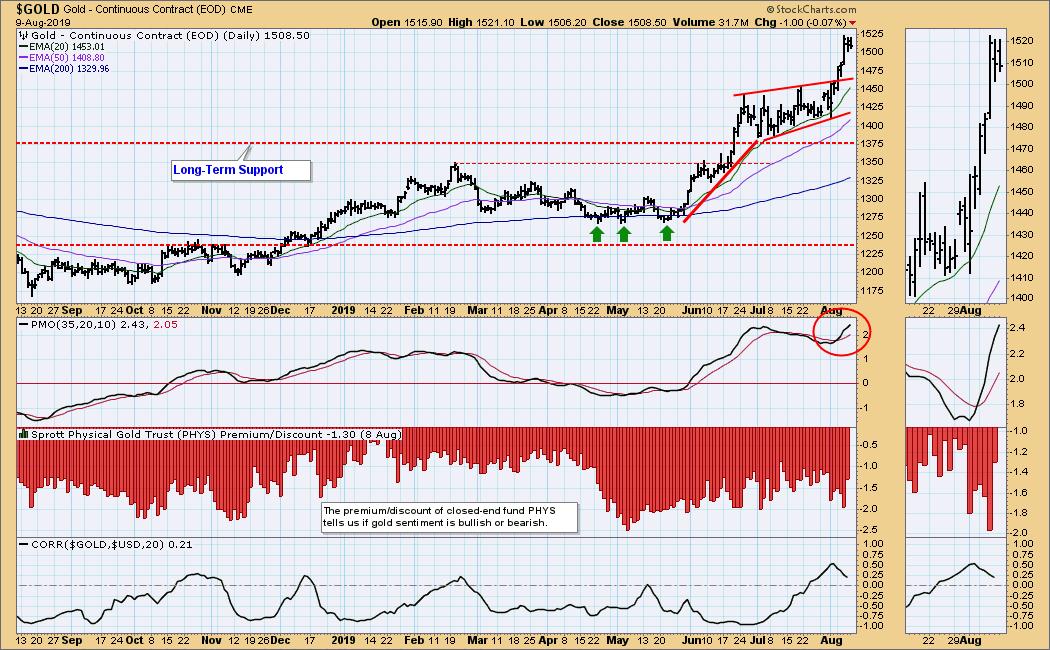
IT Trend Model: BUY as of 6/3/2019
LT Trend Model: BUY as of 1/8/2019
GOLD Daily Chart: O have been calling the June-July consolidation pattern a flag, but I think a rising wedge is probably a better name. In any case, this week gold broke out of the wedge and began another consolidation. Note that UUP has been positively correlated with the dollar for the last few weeks. Certainly, dollar strength is not currently interfering with gold's advance.
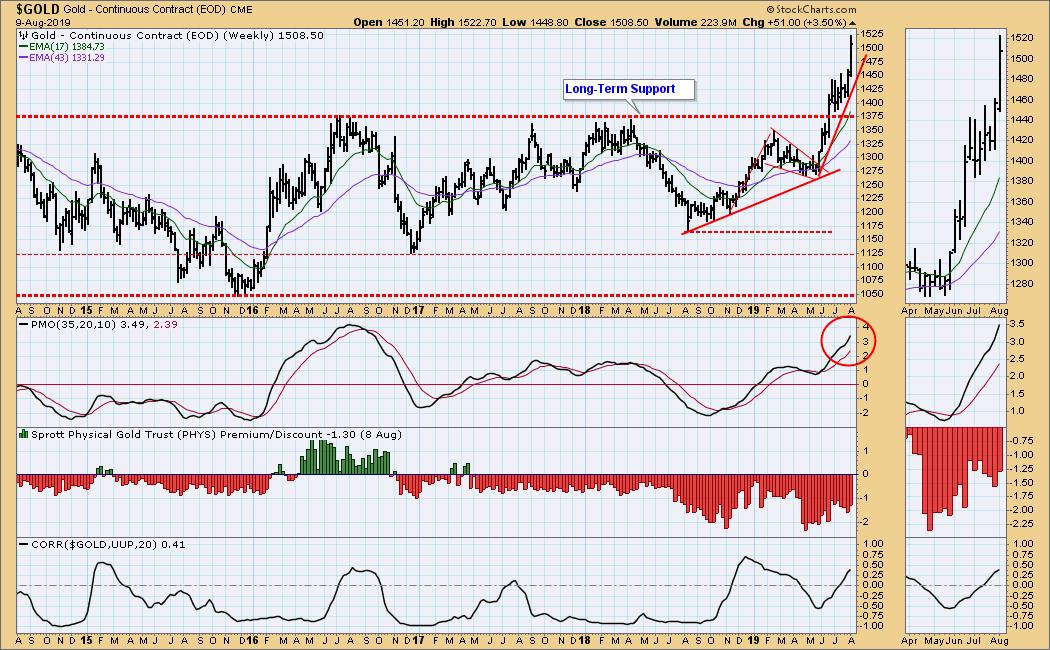
GOLD Weekly Chart: The weekly PMO is becoming overbought based upon the five years shown on the chart, but it can potentially get a lot higher if the rally continues. Price is going vertical, and that could create the need for a pullback.
CRUDE OIL (USO)
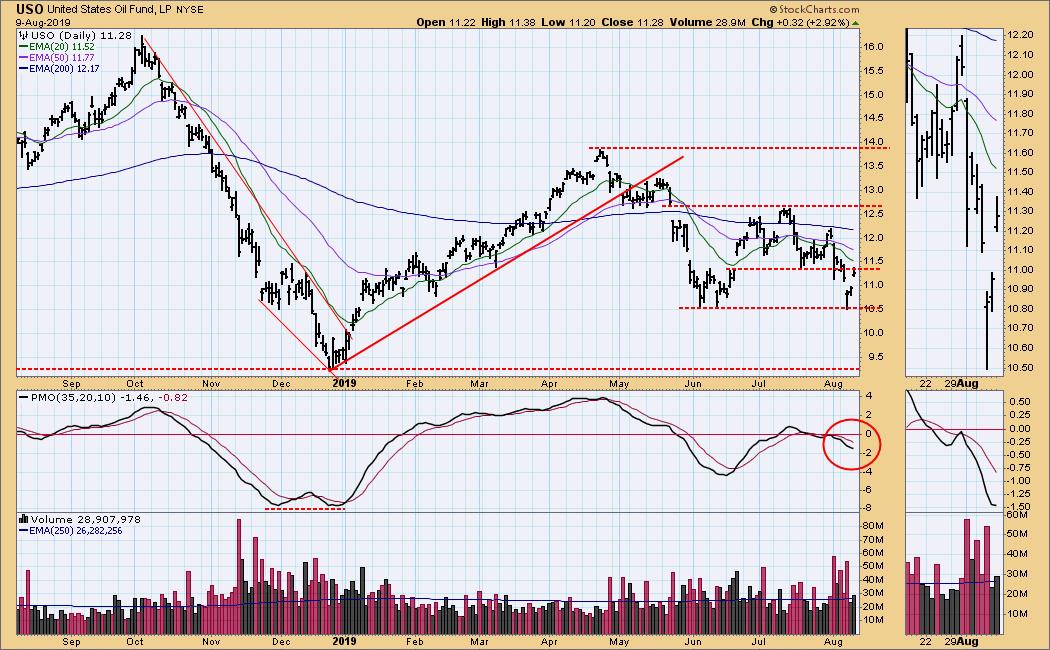
IT Trend Model: NEUTRAL as of 5/30/2019
LT Trend Model: SELL as of 6/4/2019
USO Daily Chart: Oil did some thrashing around this week, but I don't see a potential for a major move in either direction.
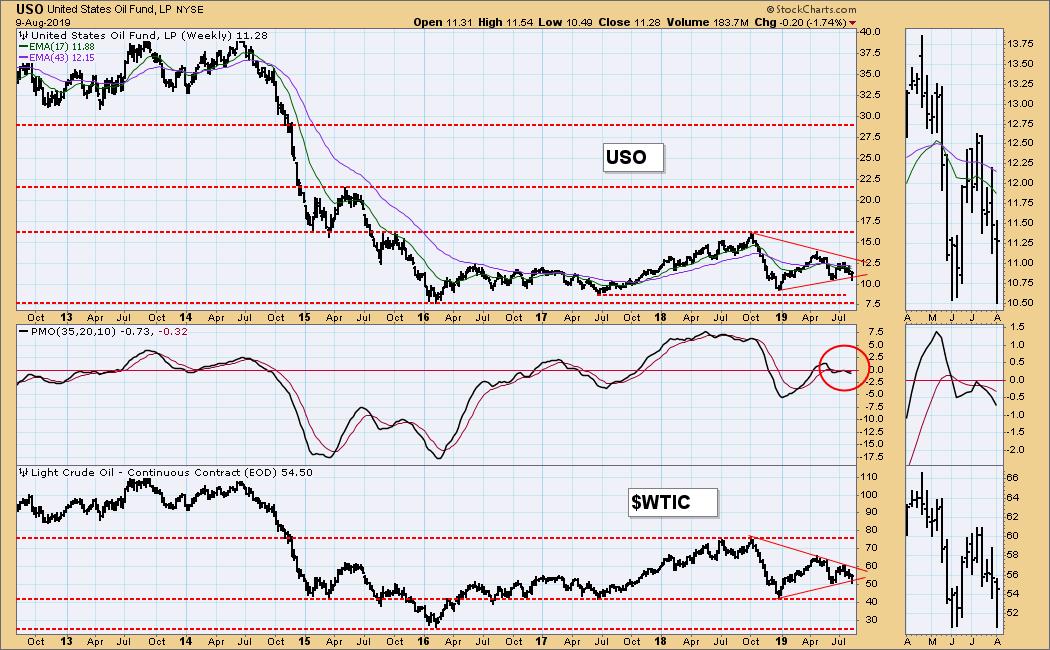
USO Weekly Chart: The weekly PMO is neutral, but I think WTIC will reach the bottom of the trading range (42) before it goes back to the top (76).
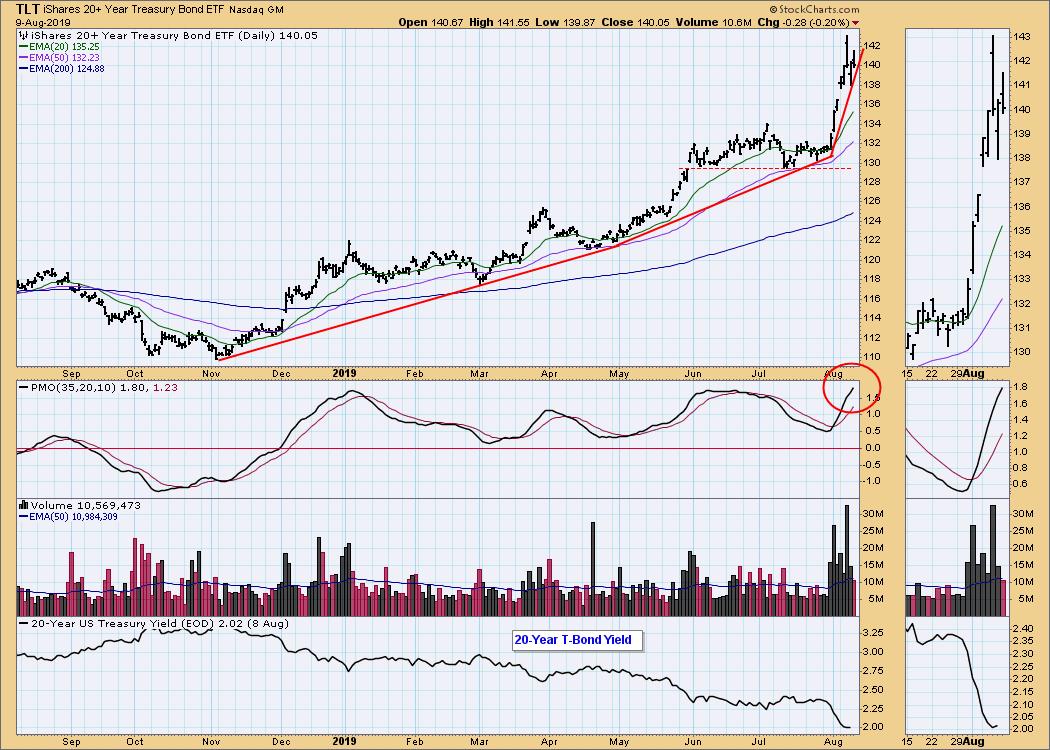
BONDS (TLT)
IT Trend Model: BUY as of 12/6/2018
LT Trend Model: BUY as of 1/2/2019
TLT Daily Chart: Bonds were all over the place this week, but they still managed to extend last week's breakout.
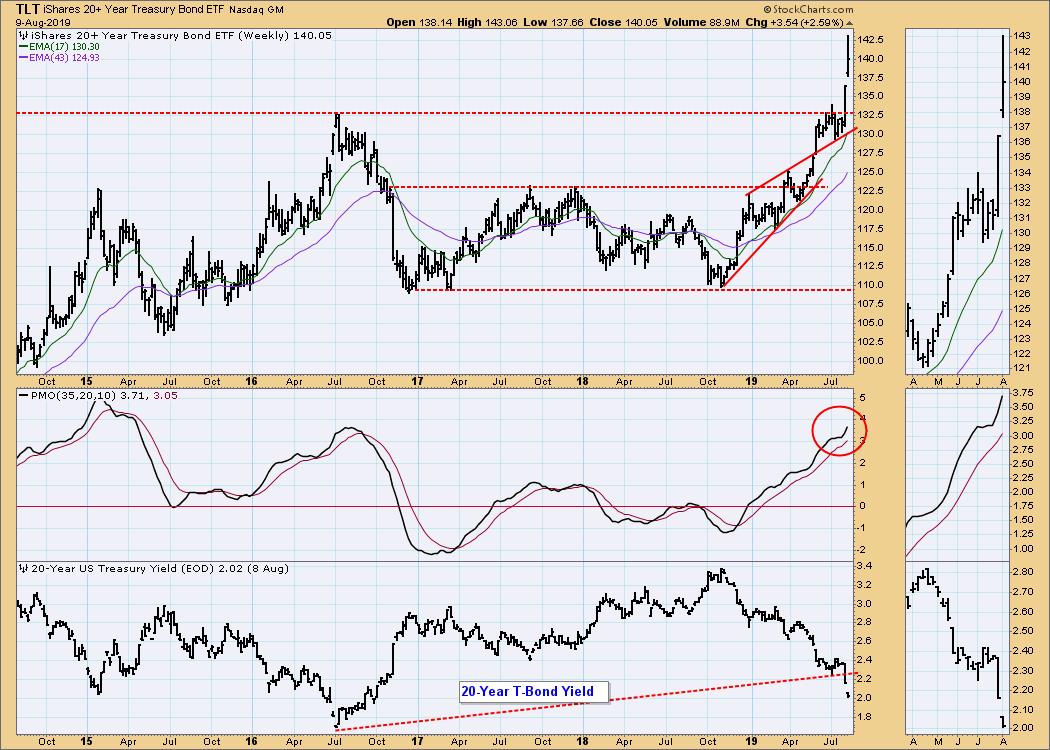
TLT Weekly Chart: The PMO is getting overdbought, but there is still room for more upside before the yield is as low as 2016. The recent vertical ascent could require a bit of a pullback or consolidation.
**Don't miss any of the DecisionPoint commentaries! Go to the "Notify Me" box toward the end of this blog page to be notified as soon as they are published.**
Technical Analysis is a windsock, not a crystal ball.
Happy Charting! - Carl
NOTE: The signal status reported herein is based upon mechanical trading model signals, specifically, the DecisionPoint Trend Model. They define the implied bias of the price index based upon moving average relationships, but they do not necessarily call for a specific action. They are information flags that should prompt chart review. Further, they do not call for continuous buying or selling during the life of the signal. For example, a BUY signal will probably (but not necessarily) return the best results if action is taken soon after the signal is generated. Additional opportunities for buying may be found as price zigzags higher, but the trader must look for optimum entry points. Conversely, exit points to preserve gains (or minimize losses) may be evident before the model mechanically closes the signal.
Helpful DecisionPoint Links:
DecisionPoint Shared ChartList and DecisionPoint Chart Gallery
Price Momentum Oscillator (PMO)
Swenlin Trading Oscillators (STO-B and STO-V)
