Last week, Mary Ellen McGonagle and I had the pleasure of speaking at The Money Show as part of the "Women on Wealth" panel, where we discussed how we can bring women to the "investment table" through education, engagement and empowerment. The presentation was unexpectedly powerful as many in the audience basically followed us out into the hallway to talk more about the educational series, newsletter, workshops and mentoring that we are in the process of building and providing. Keep an eye out! There is a clear need to bring absolute beginners into the fold and provide the tools we need to keep reinforcing the concepts we present. To better serve that community, we have changed our name to "WealthWise Women." Be sure to check out the YouTube videos of our previous shows or live on Thursdays at 3:00p EST. Join us with your friends and family!
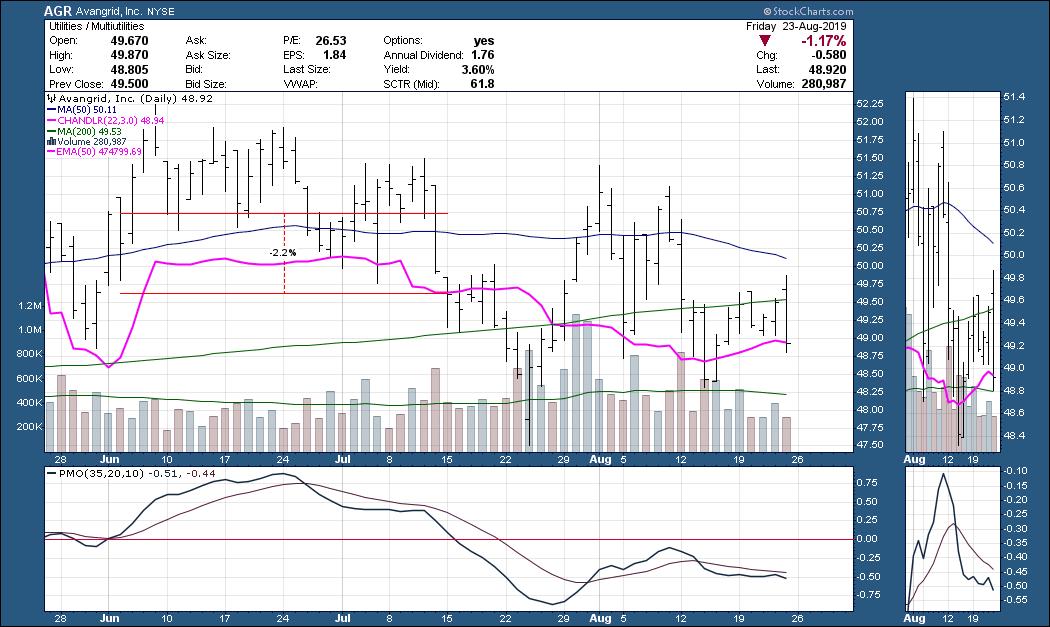
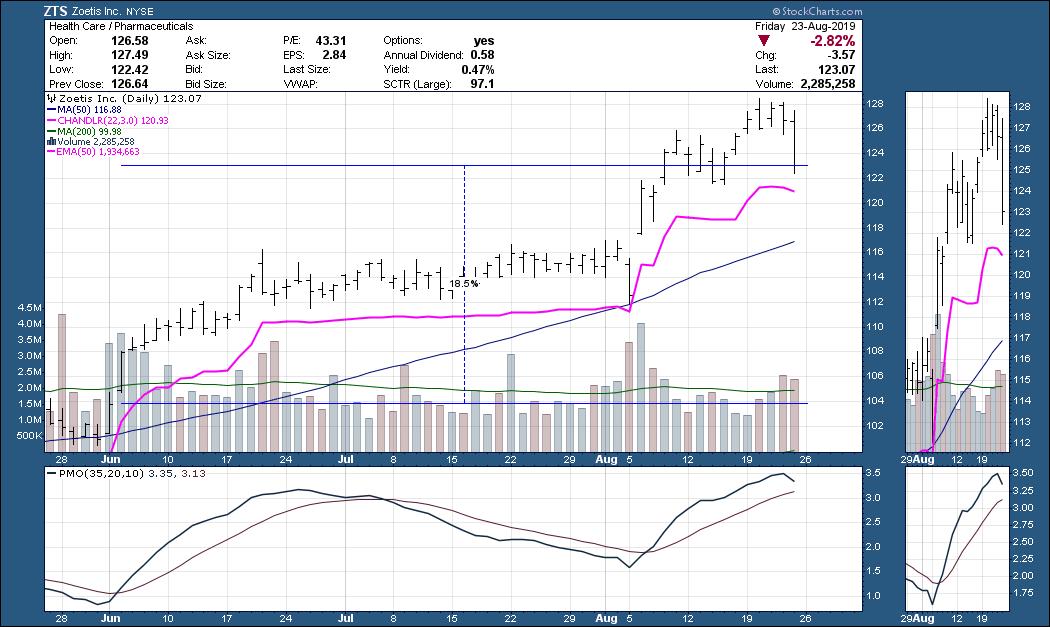
One of the concepts that I have been rolling out on the tech side of our process is the "Pink Line" model. This model is quite simple and is primarily based on the 50/200-SMAs and a pink chandelier exit, with a little momentum thrown in on the side.
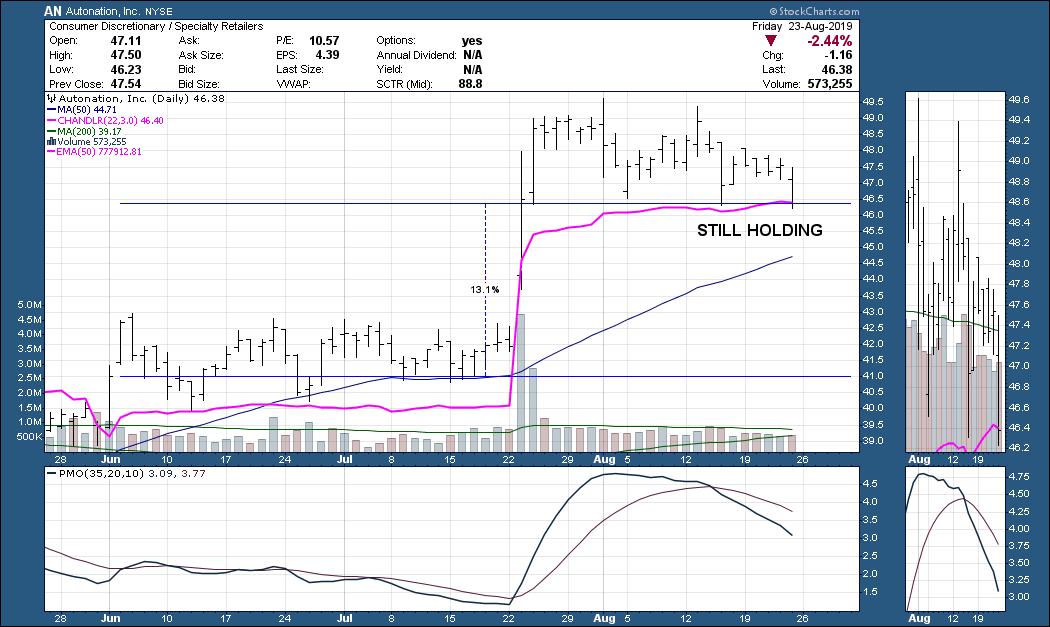
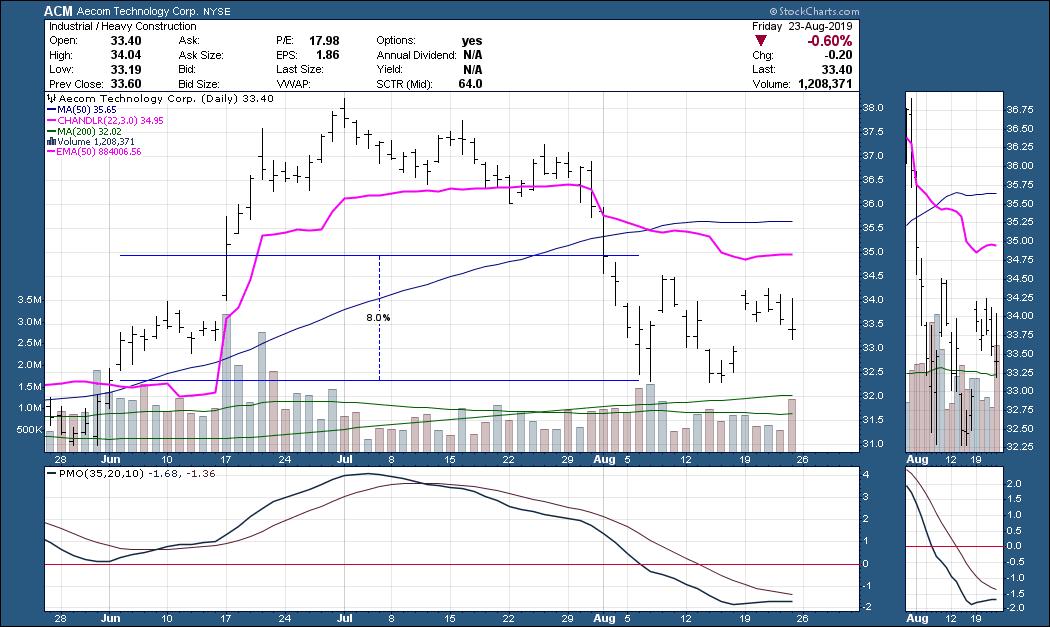
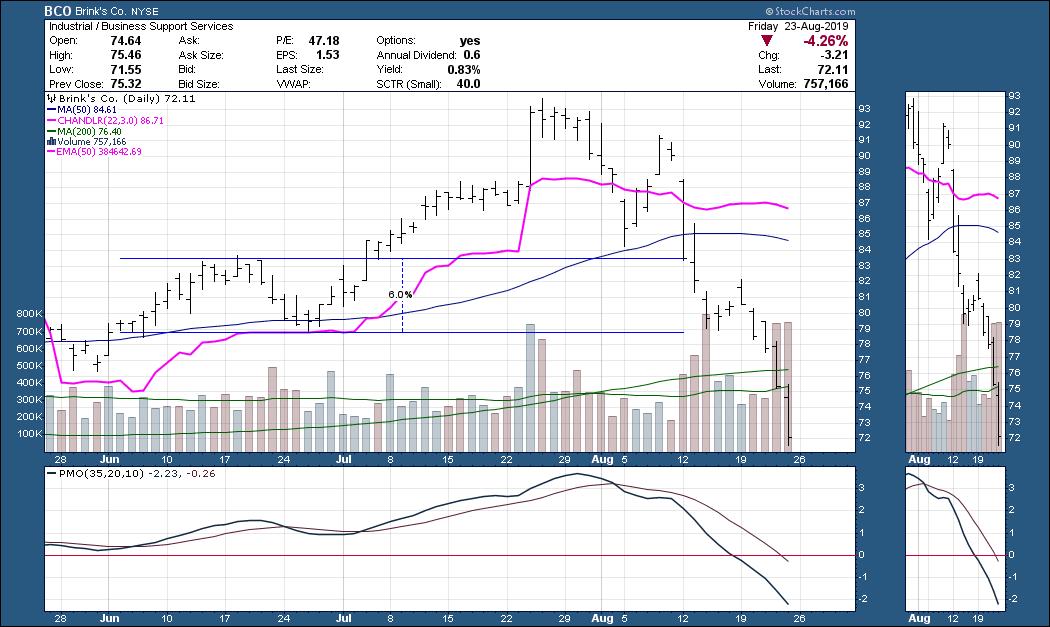
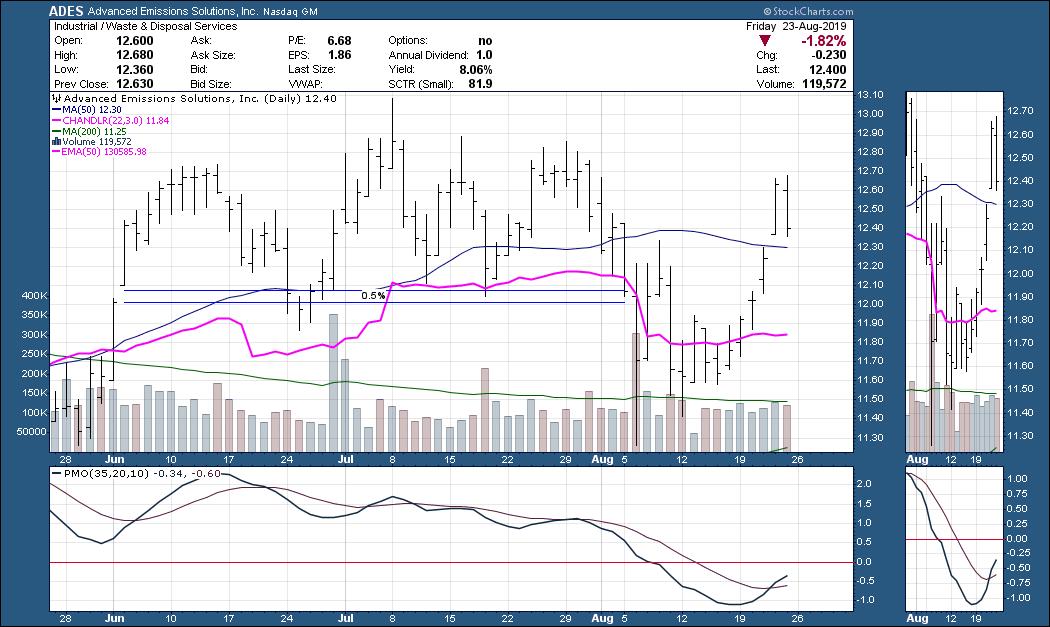
- The wind must be at your back: 50-SMA and 200-SMA are rising. Price is above the 200-SMA. (I also recommend checking whether the SPX is doing the same thing before entering)
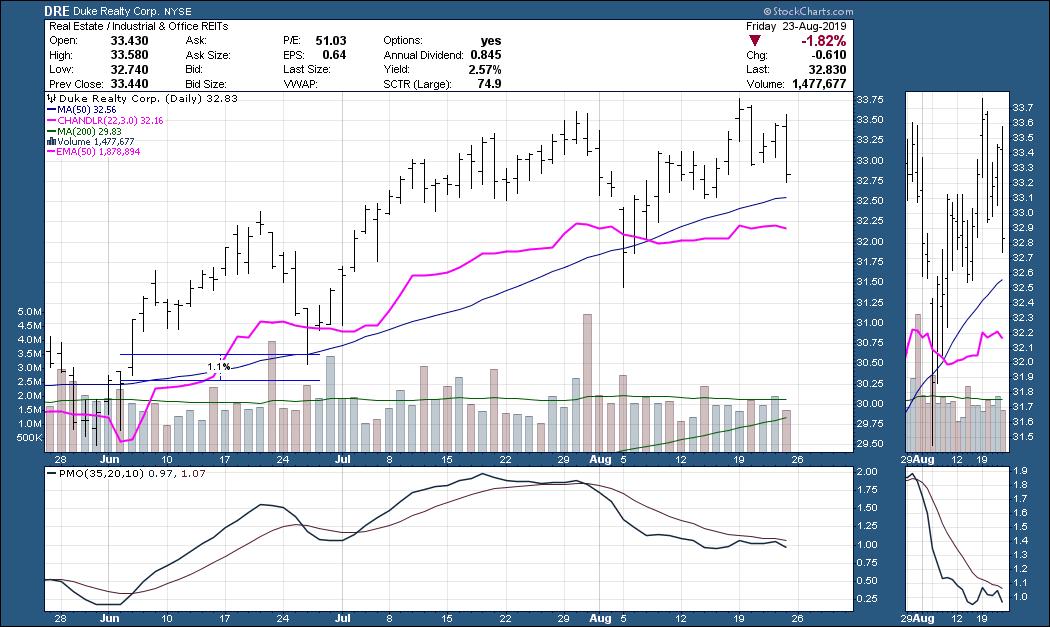
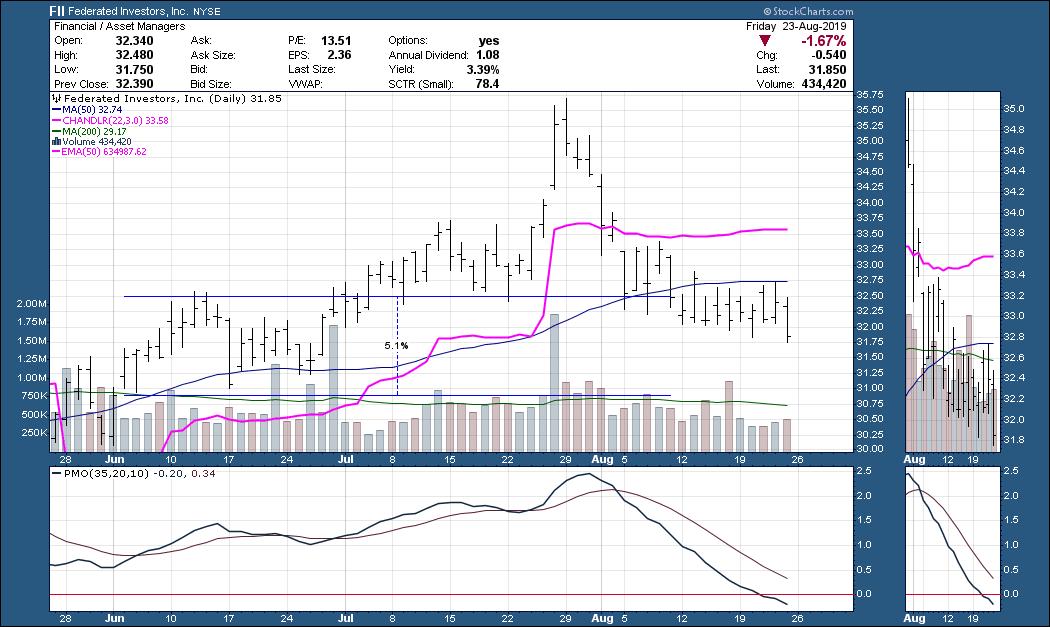
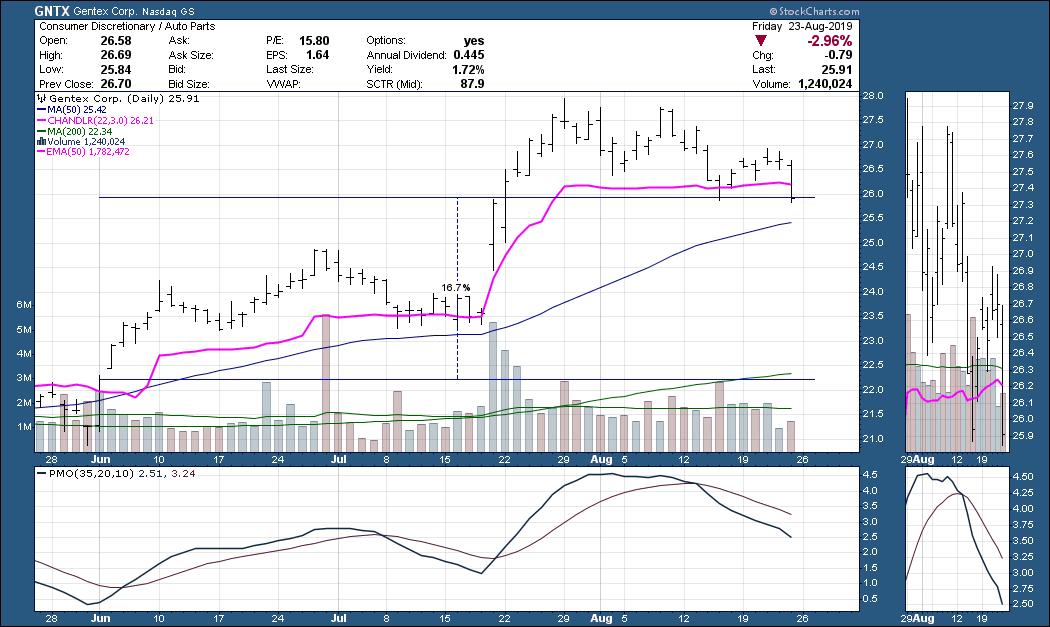
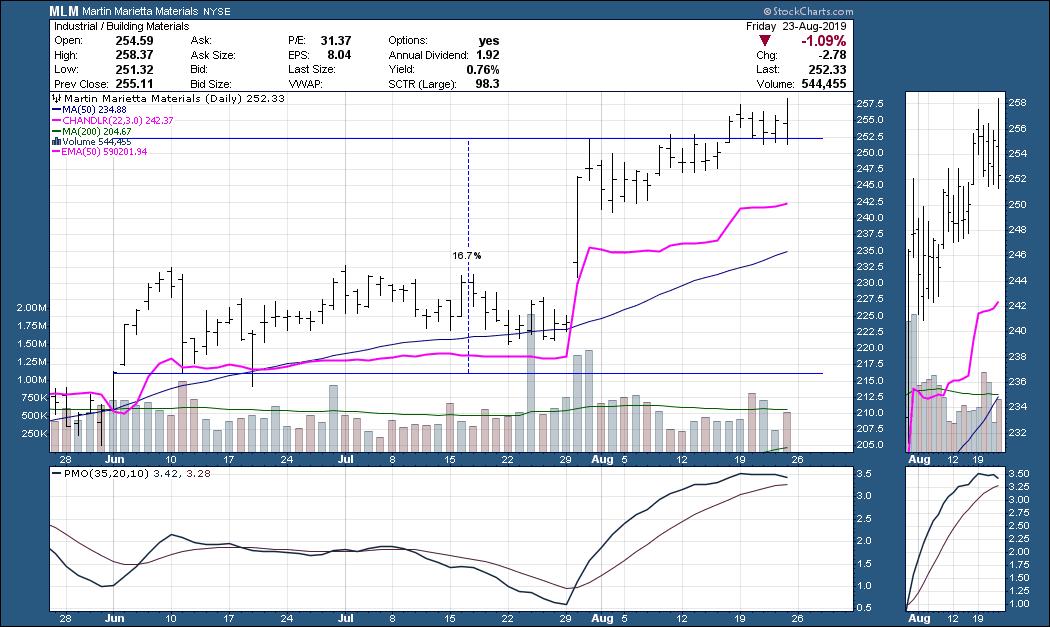
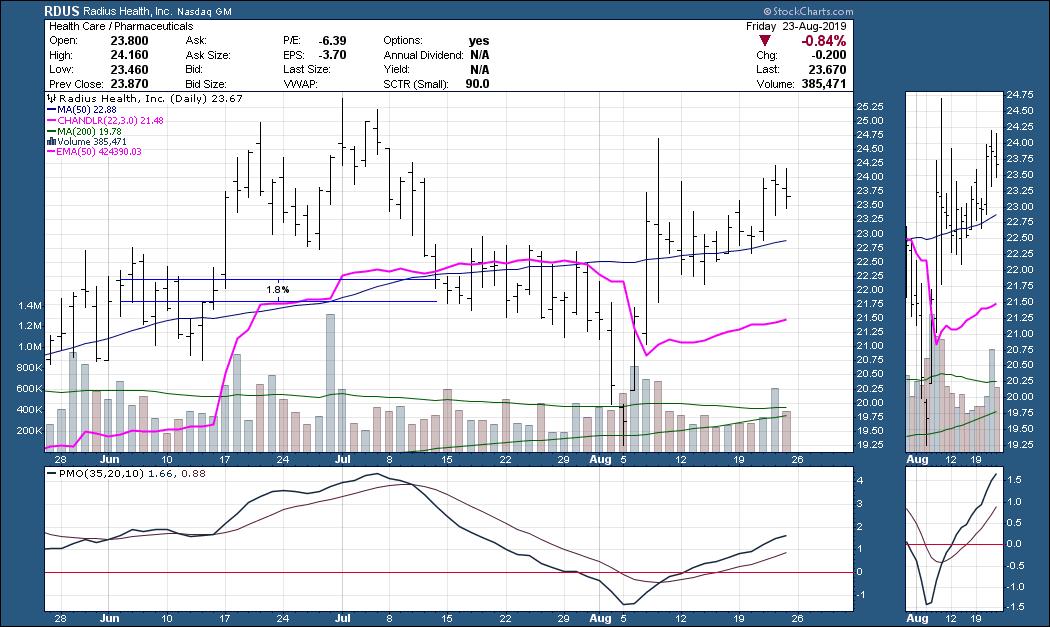
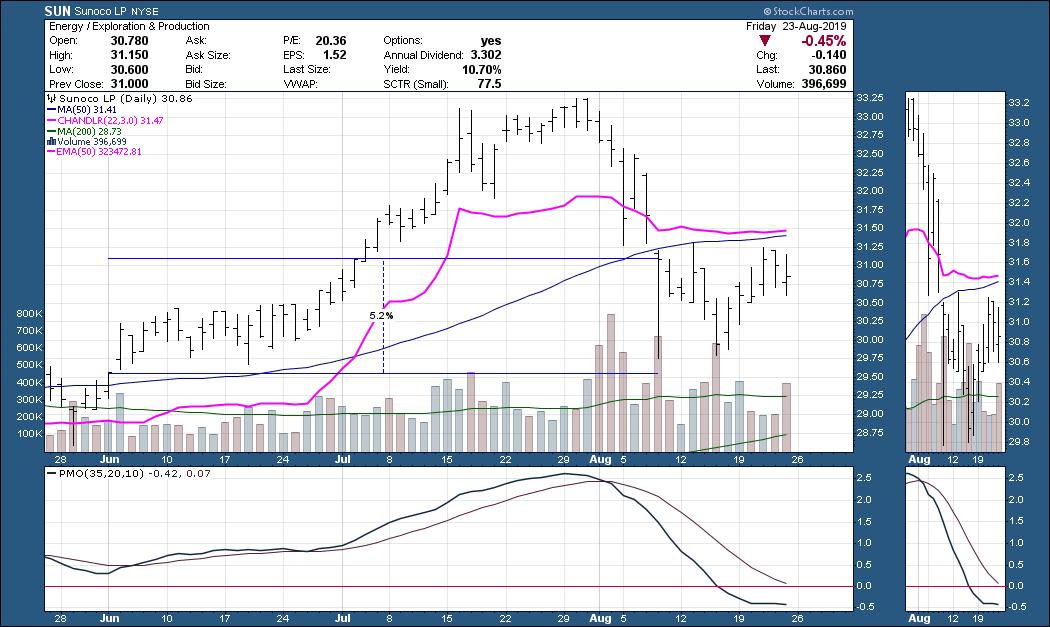
- Conservative buy points occur when price crosses above both the 50-SMA (blue line) and pink line.
- A more aggressive play would be buying when price rises above either the pink or blue lines.
- The exit "attention flags" occur when price crosses below either the pink line or the 50-SMA. I recommend analyzing the chart to determine if there is too much weakness.
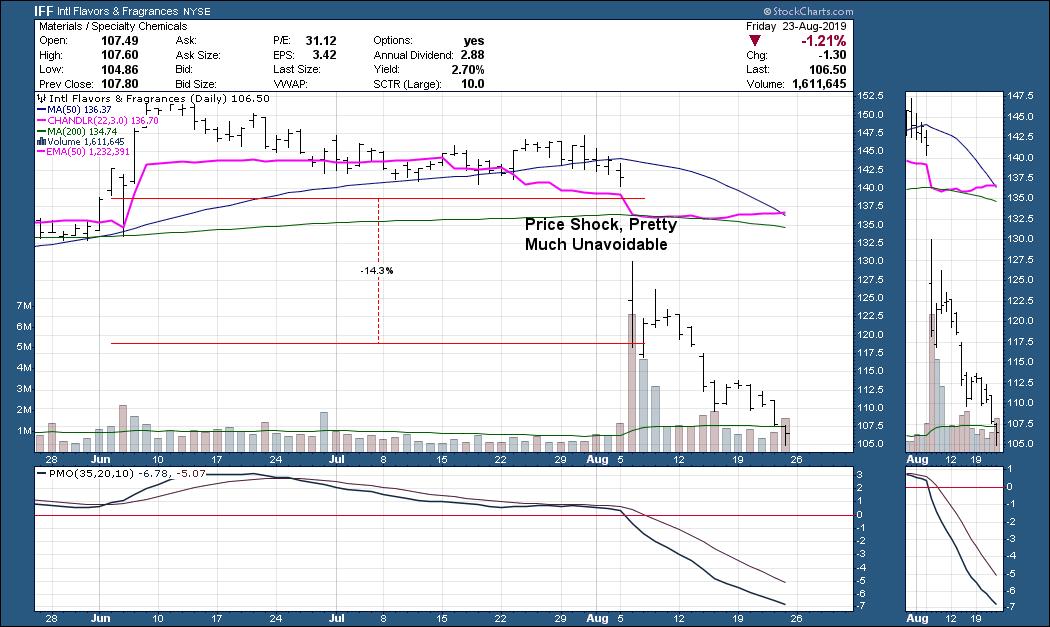
- The actual "Pink Line Exit" occurs when price drops below both the pink and blue lines.
Given the market's volatility and the fairly new IT Trend Model Neutral signals that have arrived on the major indexes, I'm not going to suggest new longs. There were only 7 "buys" today on the Pink Line scan - and they were mostly bond funds.
I wouldn't buy if the market itself is volatile or showing internal weakness. So I thought it would be instructive to step back in time to June 3rd (first trading day). Admittedly, the market probably set its last low for some time on that day, but we were also seeing moving averages and the PMO perking up as quickly as June 4th. I ran the scan as if I were running it after the close on that day and came up with 30 results. Using ONLY the mechanical pink line conservative entry of a cross above both pink and blue and an exit when the close fell below both lines, I found somewhat surprising results.
Below are a selection of charts. I checked all 30 charts and, based solely on the mechanical model, I tallied 16 winners, 9 continued holdings that are still up and 5 losers going by the model's criteria.
Conclusion: The mechanical model was successful, but it did have the advantage in this sample, in that the first trading day of June turned out to be pretty much the market bottom. There is more back-testing to do. I believe that using the DecisionPoint PMO and Trend Model for the SPX as a safe entry screen could improve results by preventing you from opening longs at the wrong time. You can ensure the wind is at your back before entering any new positions using DP analysis. What I mean is that everyone should watch the DP Scoreboards on your homepage! We picked up Neutral signals this past week, so now we wait for another IT Trend Model BUY signal or PMO BUY signal to clue us into opening possible longs. Stay tuned as I continue to back test. I did note that trying to enter the market starting in July was a bad idea, with losers equaling winners. However, had we watched momentum on the SPX, we would have seen it shift lower in mid-July before the bloodbath at the beginning of August. Mechanical signals and models are great, but there is generally some analysis work to do. Remember, I wouldn't have been able to enter all 30 positions on June 3rd - I would've had to do my homework and pick the best candidates based on my analysis process.
Watch the latest episode of DecisionPoint with Carl & Erin Swenlin LIVE on Fridays 4:30p EST or on the StockCharts TV YouTube channel here!
Technical Analysis is a windsock, not a crystal ball.
Happy Charting! - Erin
erinh@stockcharts.com
Helpful DecisionPoint Links:
DecisionPoint Shared ChartList and DecisionPoint Chart Gallery
Price Momentum Oscillator (PMO)
Swenlin Trading Oscillators (STO-B and STO-V)
**Don't miss DecisionPoint Commentary! Add your email below to be notified of new updates"**


