Editor's Note: This article was originally published in Martin Pring's Market Roundup on Wednesday, August 27th at 4:15pm ET.
One simple and very much overlooked technique for trend identification is to observe whether the price of a security is experiencing a series of rising peaks and troughs. When that progression reverses to one of a series of declining peaks and troughs, it represents one piece of valuable technical evidence that the tide has turned. The top panel of Chart 4 tells us that the S&P has experienced a series of rising peaks and troughs since last December. That action clearly indicates positive technical characteristics. It's also a useful idea to see whether such action is being supported by a majority of the sectors and key industry groups.
Charts 4, 5 and 6 take a closer look at current action and show that the S&P is being supported by virtually every sector and key industry groups. Chart 4 reflects defensive sectors and groups, which have generally outperformed since December. This strong relative action by defensive areas is typical of an equity market emerging from a bear trend. Utilities, REITS and staples have all followed the upward zig-zagging characteristics displayed by the S&P. In addition, they have all achieved new bull market highs. Telecom is the standout, having begun a series of declining peaks and troughs. It clearly does not support the idea of a generalized market rally.
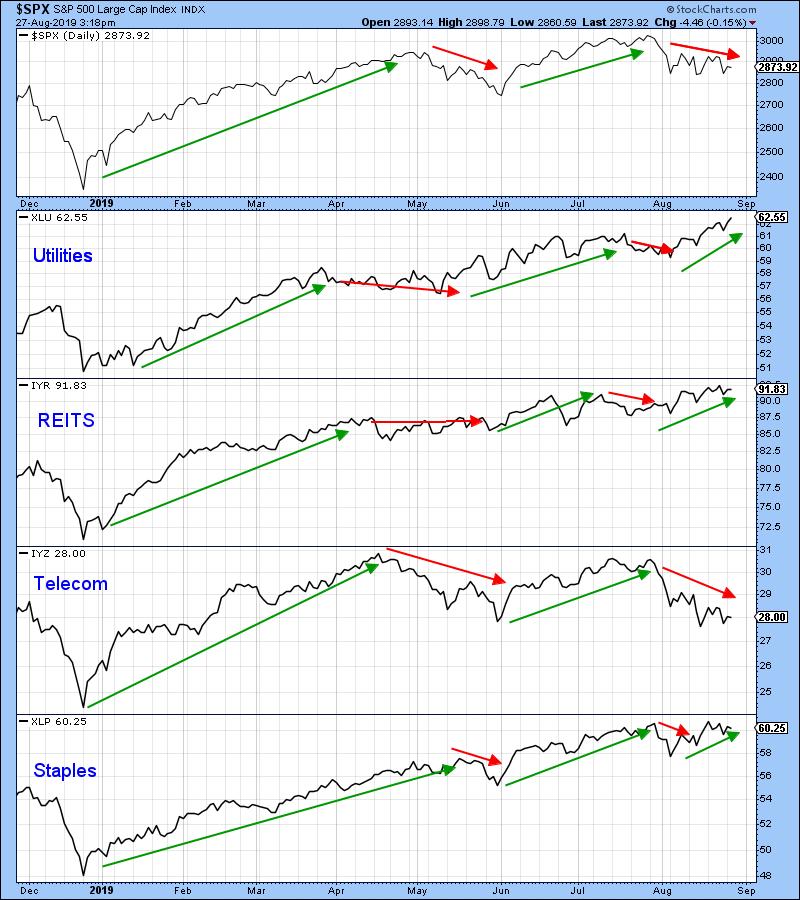
Chart 4
The sectors in Chart 5, for the most part, also reflect the higher peak-trough progression scenario. One area to watch is the financial sector, which is having difficulty remaining above its May low. This has been flagged by the horizontal blue arrow. It's still bullish based on this technique, but is facing an important test in the period directly ahead. However, cyclicals, industrials, health care and technology are in firmly bullish territory. Note that I am using the iShares industrial sector ETF, as the SPDR (XLI) combines industrials with transports in its portfolio. I prefer to split them, as transports tend to be a leading sector and industrials a lagging one. Placing apples and oranges in the same bag does not make much sense to me.
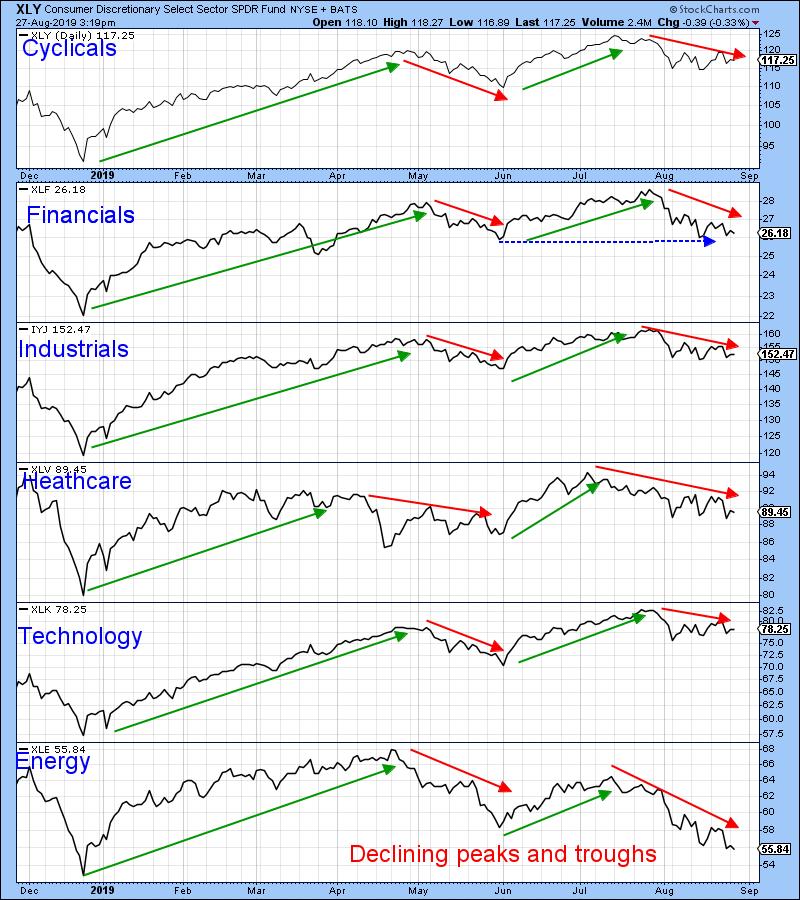
Chart 5
Returning to Chart 5, we see that one sector (energy) has started to trace out a series of declining peaks and troughs. If the markets do slip through those red trend lines in Charts 1 and 2, this weakness suggests that energy could well lead the way.
Metals and Mining (XME), as Chart 6 shows, has experienced a declining peak, but the rising troughs are still intact. The remaining groups in the chart, are continuing to experience a positive peak trough progression, though transports may be close to a break of their May low. Until the price does register a post May low, it is wiser to assume that the overall trend of rising peaks and troughs is intact. That May low is critical, though, since the IYT already experienced a lower peak in late July. A post-May low would therefore signal declining peaks and troughs.
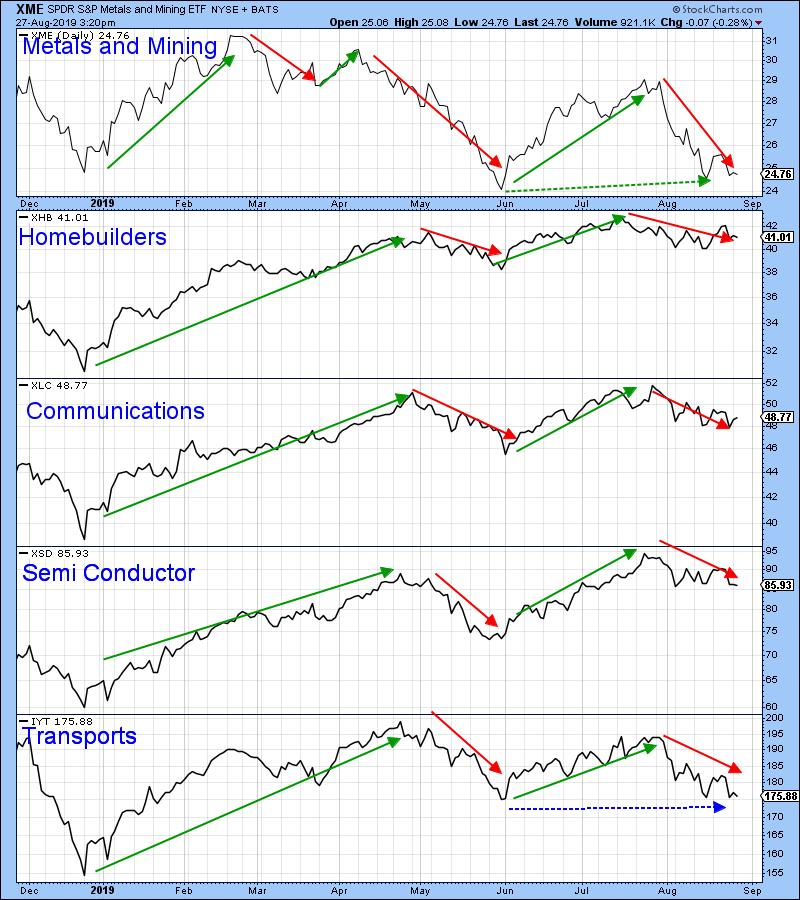
Chart 6
Good luck and good charting,
Martin J. Pring
The views expressed in this article are those of the author and do not necessarily reflect the position or opinion of Pring Turner Capital Group of Walnut Creek or its affiliates.


