I recently tweeted about the percent of stocks above their 200-day moving averages, pointing out that there is a key line in the sand for this important breadth indicator. This resulted in a fantastic question about looking at market breadth in cap-weighted terms vs. equal-weighted terms. In this article, we'll unpack why market breadth makes the most sense on equal-weighted terms and review where this indicator stands today.
The chart I sent around showed the S&P 500 index as well as the percent of SPX names above their 200-day moving averages, along with the percent of stocks above their 50-day moving averages.
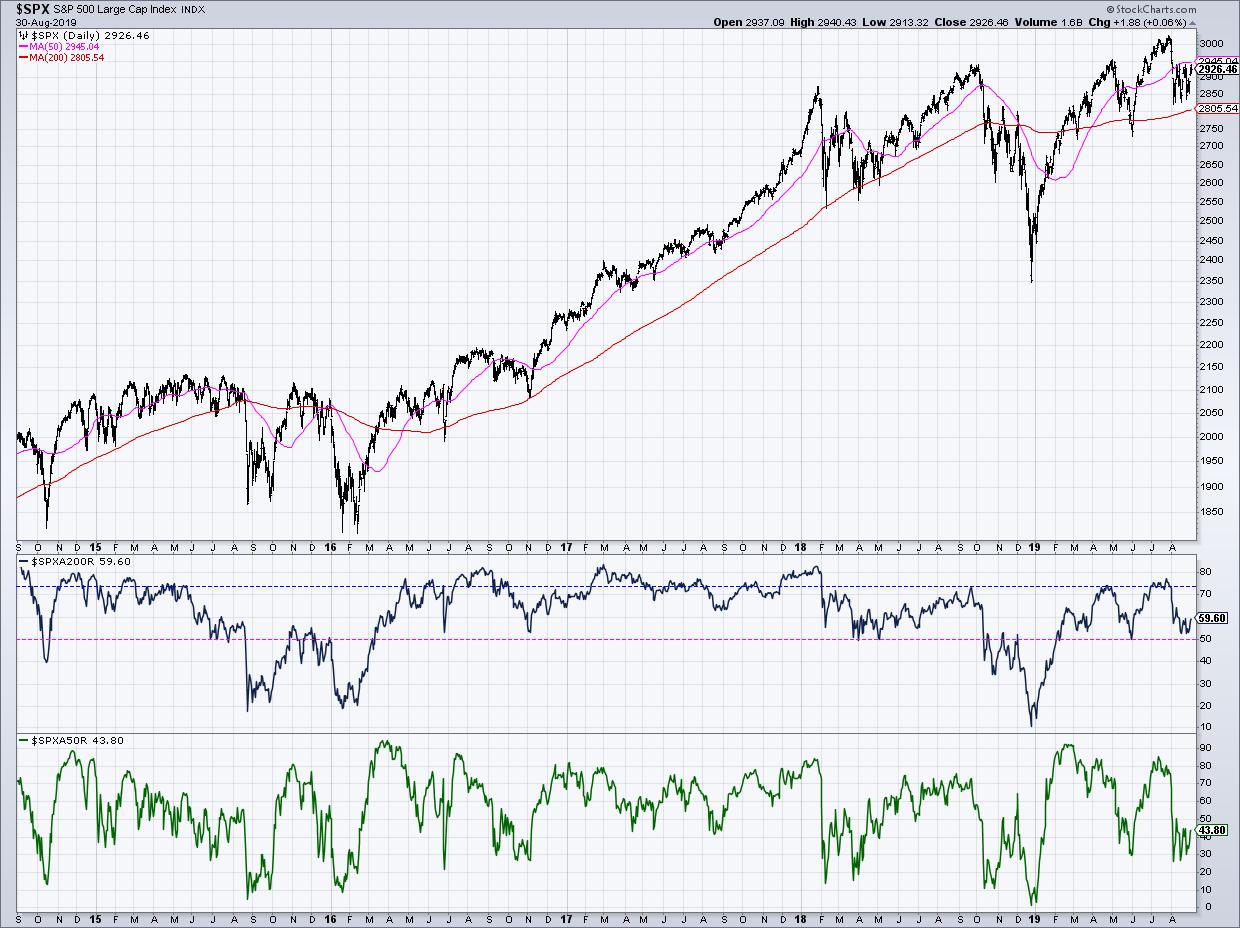
I find the former to be an excellent measure of market participation in the intermediate-term. To put it another way: when the market makes a significant move over a couple of weeks, how many stocks are participating in the move?
The most recent selloff pushed this indicator from about 75% down to just above 50%. I often put a horizontal line at the 50% level just as a reminder that this is a key differentiator.
If the market pulls back but we remain above the 50% level, this suggests most stocks are remaining in an intermediate-term uptrend and the market overall is still in positive form. If this indicator breaks down through the key 50% point, then it often is a warning of further downside for the S&P 500.
So why do we look at market breadth on equal-weighted terms? And should we consider other forms?
As an example, we could look at breadth in cap-weighted terms, so, instead of measuring the number of stocks above their long-term moving averages, we could instead measure a percent of market cap above their moving averages. If you think about it, though, that would mean that a stock like AAPL or MSFT breaking the 200-day moving average would cause a large shift in this indicator, while some of the smaller SPX names would barely be a rounding error.
For me, it goes back to the very reason you look at breadth in the first place. The S&P 500 index (and most widely followed equity indexes, for that matter) are cap-weighted. As a result, they are very skewed to the largest companies and to the sectors that have the biggest weight in the index.
The point of market breadth is to look below the hood a bit and see how all the other stocks are participating relative to the trends of the largest names. So, when the SPX does one thing while the breadth indicator does something else, this tells you of a divergence between the larger and smaller companies in the index.
Every market breadth indicator I followed is based on an equal-weighted calculation for this very reason!
If you're interested in learning more about market breadth, check out this primer on charting market breadth, as well as this list of commonly-used breadth indicators.
RR#6,
Dave
David Keller, CMT
President, Sierra Alpha Research LLC
Disclaimer: This blog is for educational purposes only and should not be construed as financial advice. The ideas and strategies should never be used without first assessing your own personal and financial situation, or without consulting a financial professional.
The author does not have a position in mentioned securities at the time of publication. Any opinions expressed herein are solely those of the author and do not in any way represent the views or opinions of any other person or entity.


