 The lack of new highs may seem like a concern, but one cannot talk about new highs without also looking at new lows because there are two sides to the story. The S&P 500 is within 2% of an all time high and there were just 28 new highs on Friday. There were over 100 new highs in early June, but new highs have not exceeded 50 since early September. There is an upside leadership issue within the S&P 500, but this alone is not enough reason to turn bearish.
Despite fewer new highs, new highs are still outpacing new lows, of which there were only 2 on Friday. This is what really matters because it means there are still more stocks in strong uptrends (hitting new highs) than strong downtrends (hitting new lows). Now let's measure it with an indicator.
Two weeks ago I featured a timing technique using the High-Low Line for the S&P 500. Basically, the index has a bullish bias as long as there are more new highs than new lows. We can measure this on-going differential using the High-Low Lines, which rises when new highs outpace new lows. A rising High-Low Line is net bullish for the index, regardless of the total number of new highs.
Today I want to expand on this concept with the High-Low Lines for the six largest sectors in the S&P 500. These indicators can be used to find the leading sectors and measure the overall health of the S&P 500.
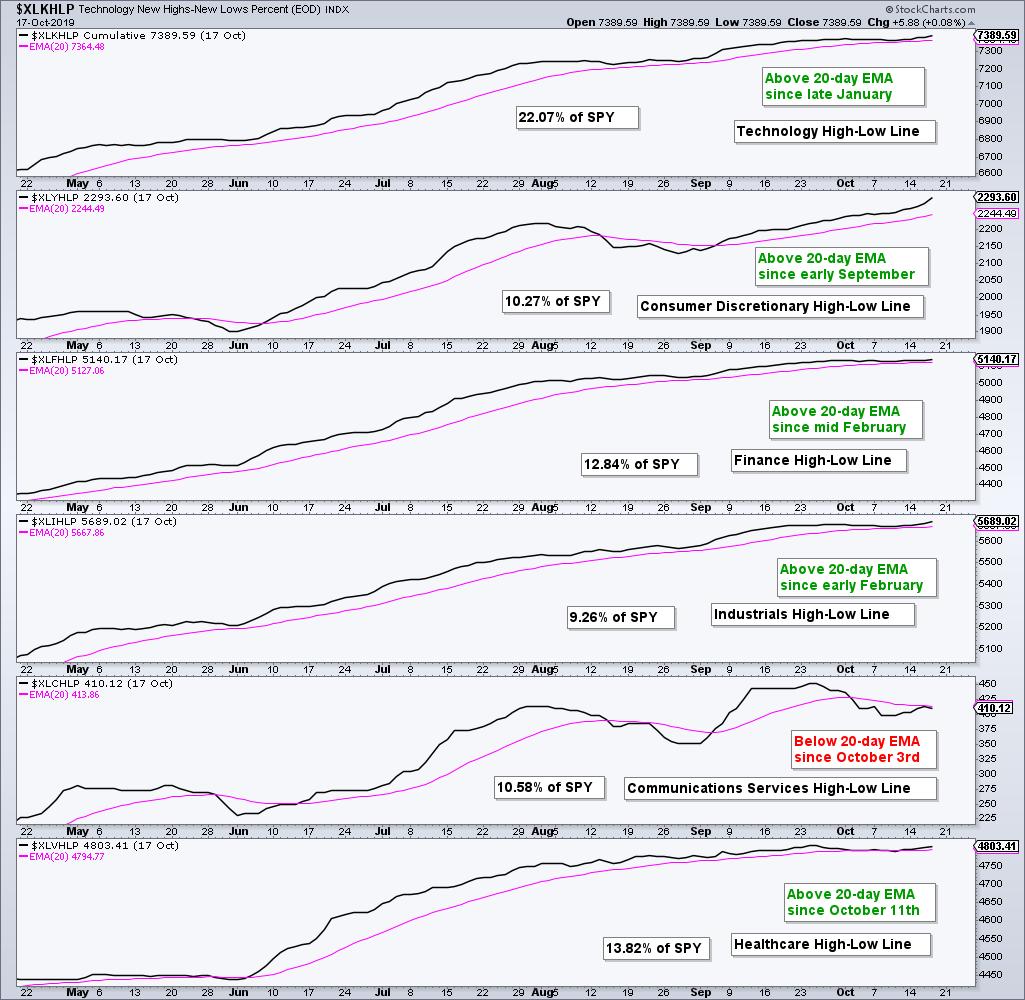
The charts below show these High-Low Lines with their 20-day EMAs and the sector weight. Technology is by far the largest sector and accounts for 22% of SPY. Currently five of the six High-Low Lines are above their 20-day EMAs and rising. The Technology High-Low Line has been rising the longest as it crossed its 20-day EMA back in late January. The Finance and Industrials High-Low Lines have also been strong for an extended period as they crossed their 20-day EMAs in February.
One cannot be bearish on SPY when the High-Low Lines for Technology, Industrials and Finance are rising and leading.
Elsewhere, the Consumer Discretionary High-Low Line turned up in early September, while the Healthcare High-Low Line turned up last week. The Communication Services High-Low Line is the most erratic of the six because it has the fewest component stocks. It is also the only one below its 20-day EMA.
Putting it all together, the five sectors with rising High-Low Lines account for 68% of SPY and this is more than enough to support an uptrend in the ETF. Of note, the Consumer Discretionary High-Low Line turned up quite sharply this week as new highs expanded in the sector. This is also a positive sign for the broader market.
Chartists looking to time these sectors and SPY can watch the High-Low Lines for signals. These signals are not very frequent and they can sometimes catch big trends, such as the uptrend in XLK since late January. At the very least, the direction of these lines tells us which side of the market we want to trade. Right now, this is the bullish side for SPY and five of the six sectors.
Special Announcement
From here on out I am the Chief Technical Strategist at TrendInvestorPro.com, a website offering market timing and trend-momentum strategies. As with Art's Charts, the analysis is objective, systematic and educational. I will continue to contribute at StockCharts on a limited basis, but the bulk of my content will be on TrendInvestorPro.
Access to the website is free this week. Next week I will open up for subscriptions so stay tuned! Analysis is geared towards the weekend trader or investor with a publishing schedule as follows:
- Thursdays - ETF Ranking and Grouping: Systematic ranking and grouping of 60 core ETFs for trend-rotation strategies. This report includes chart analysis and a PDF ChartBook featuring all 60 ETF charts with annotations and comments.
- Fridays - The State of the Stock Market: Broad market analysis and timing with index and sector breadth models.
- Saturdays - Stock Setups: A weekend report highlighting stocks with uptrends and bullish setups (when the broad market environment is bullish). Should the market environment turn bearish, I would then highlight stocks with bearish setups.
I will also be offering periodic strategy pieces and educational content.
Click here to checkout TrendInvestorPro.com
Let the new journey begin!

Choose a Strategy, Develop a Plan and Follow a Process
Arthur Hill, CMT
Chief Technical Strategist, TrendInvestorPro.com
Author, Define the Trend and Trade the Trend
Want to stay up to date with Arthur's latest market insights?
– Follow @ArthurHill on Twitter


