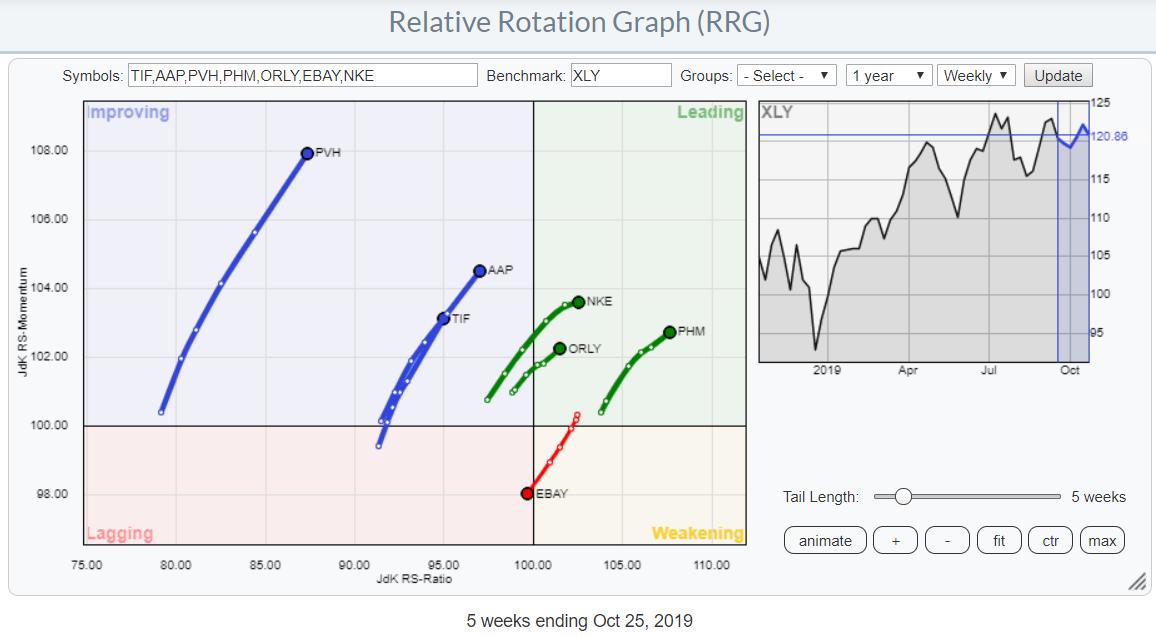
 Selection of Consumer Discretionary stocks vs XLY
In last week's Sector Spotlight episode, I discussed the positive rotation of the Consumer Discretionary sector on RRG. During the live show, I focused (too much) on the sector and only managed to talk about a few individual stocks. This article will highlight some of the names in that sector that are worth keeping an eye on.
To find this selection of discretionary stocks that are displayed on the RRG above, you'll need to do the following:
- Load the members of the Consumer Discretionary sector on a weekly RRG against XLY (available in the drop-down box).
- Toggle through the stocks using Ctrl+Dn to highlight the tails and analyze the rotation.
- Note the stocks showing a "strong" rotation. In general, that means an RRG-Heading between 0-90 degrees, inside improving and close to 100 on the RS-Ratio scale, inside leading and coming from either improving or from weakening or, lastly, inside weakening but at high RS-Ratio values and curling back up (rising on the RS-Momentum scale)
- Repeat 1-3 on a daily RRG.
- Compare notes for both and see if stocks show up on both time frames, good or bad.
The daily version of the selected stocks is printed below:
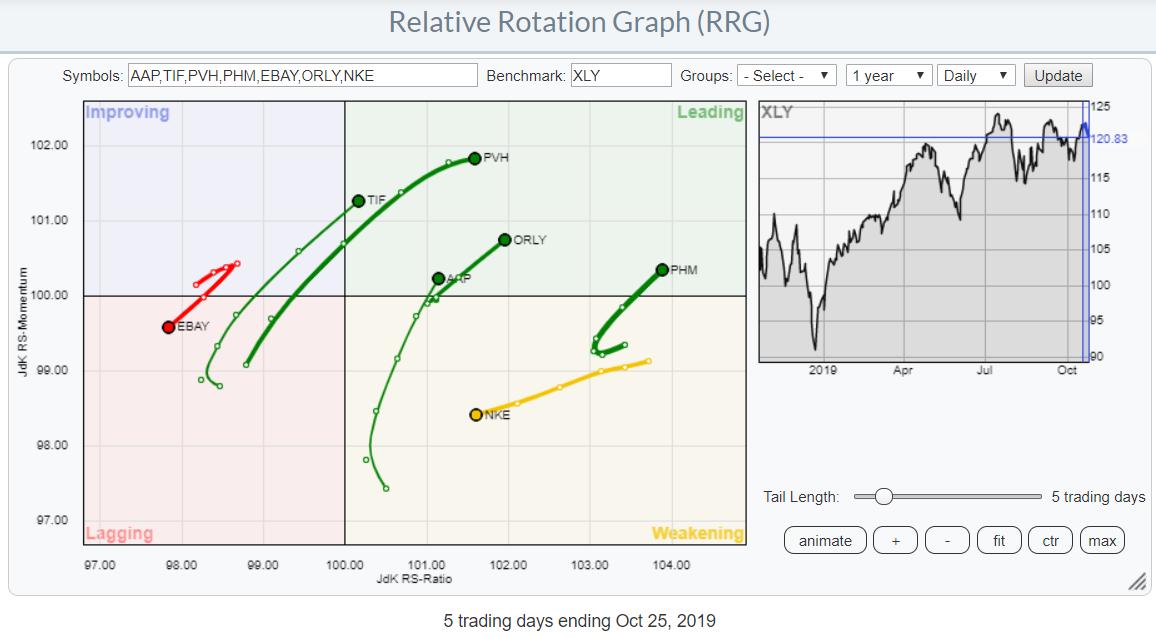 Selection of Consumer Discretionary stocks vs XLY
EBAY
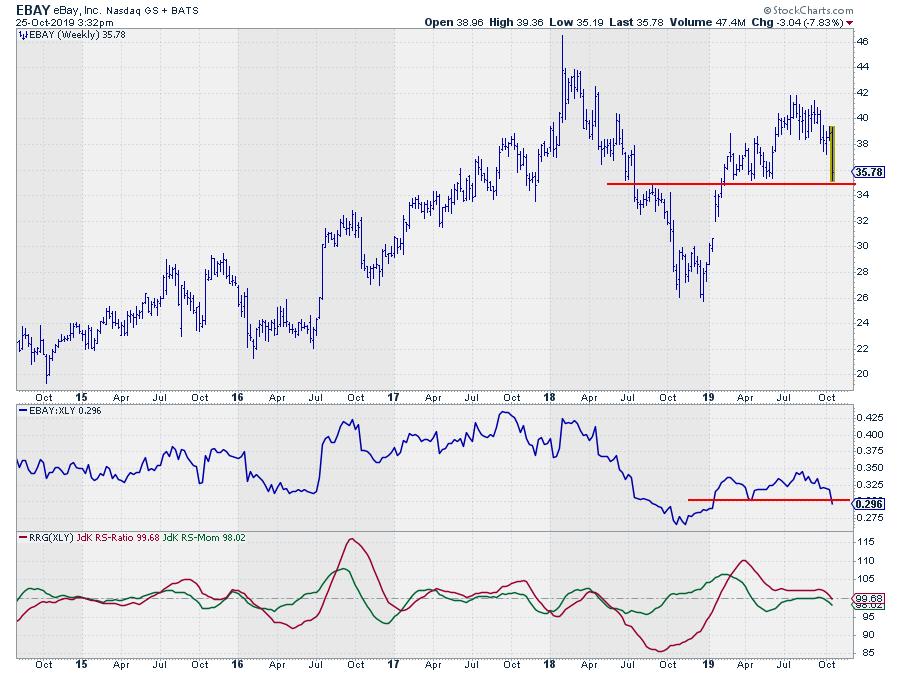
EBAY is the stock to watch out for in this sector! On the weekly RRG, it just crossed over from weakening into lagging, while the tail on the daily RRG shows a sharp rotation back into lagging following a short move through improving.
The sharp drop in the last two days has brought EBAY to support at $35, from which a recovery rally can take place to close the gap at $38 or test former support as resistance at $37. From a relative point of view, the trend is now definitely broken.
Dropping below $35 on the price chart will very likely accelerate a further decline.
Tiffany & Co.
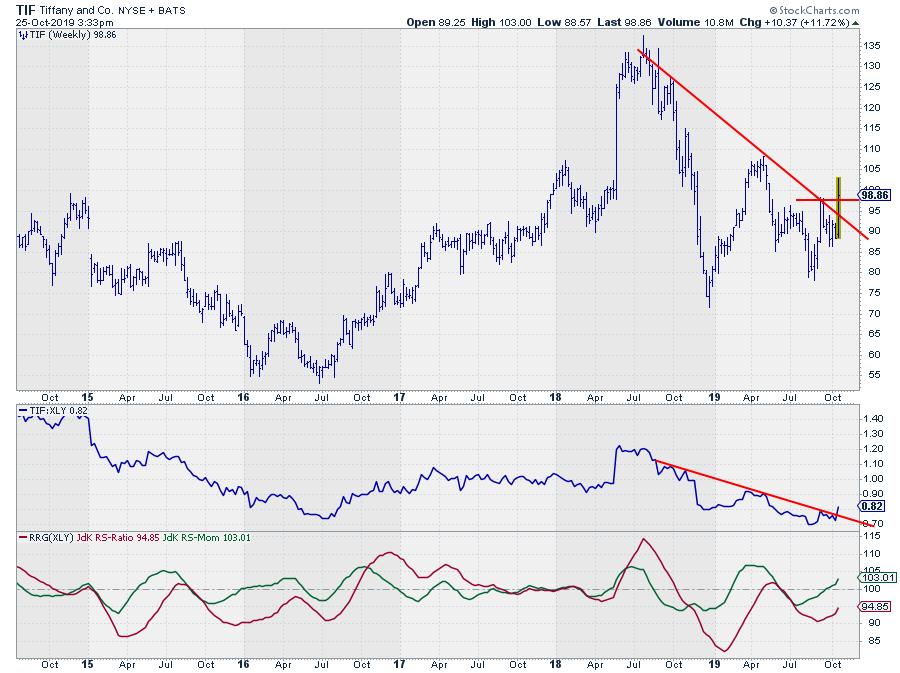
Of the stocks inside the improving quadrant, I like TIF most.
On the price chart, it is breaking a downward-sloping resistance line as well as taking out its previous high. Both are positive signs, and the break above its previous highs, after having put a higher low into place, triggered a new uptrend in price (higher lows followed by higher highs).
A similar situation can be seen in the relative strength line against XLY. The downward-sloping resistance line has been broken and the last peak is about to be taken out to the upside.
All in all, TIF seems ready for more upside movement.
NIKE
NKE is a bit tricky. On the weekly RRG, the tail has just entered the leading quadrant but has been flat for the last week. On the daily RRG, the tail is inside the weakening quadrant and heading towards lagging but is still well above the 100-mark on the RS-Ratio.
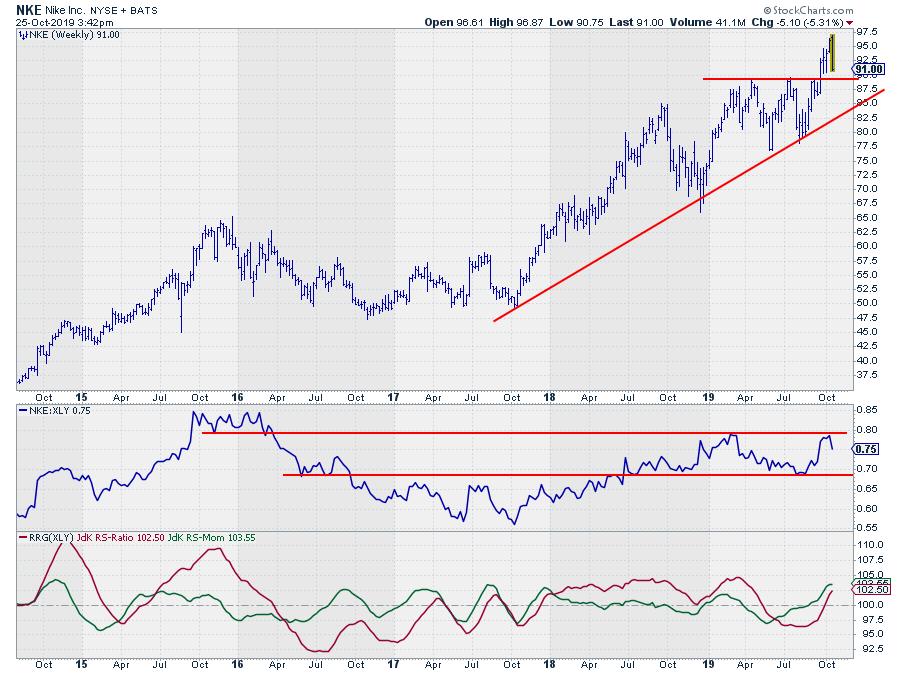
The sharp drop in price last week has taken NKE back to its breakout level near $90. As long as this level holds, that seems to be a good buying area (with stops just below that gap-area of $88-90).
The bounce off of overhead resistance in relative strength has caused the tail to flatten this week. For the rotation to continue positively into the leading quadrant, that barrier needs to be broken soon.
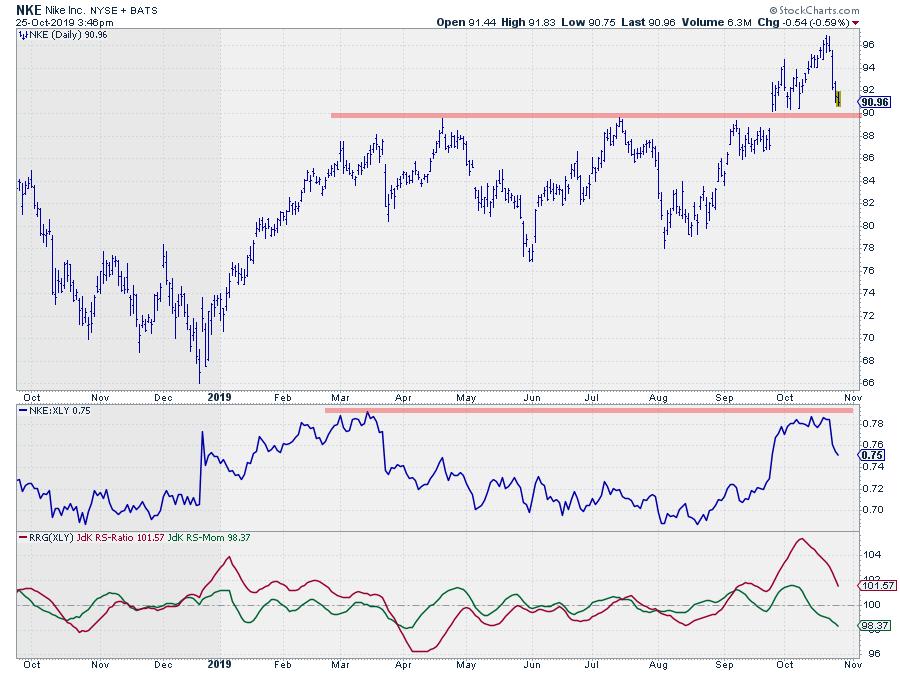
The daily chart shows more detail. The gap-support area between $88-90 is clearly visible here, and so is the overhead resistance in relative strength.
The JdK RS-Momentum line is now dragging the RS-Ratio line down towards 100. When support in price holds, the relative momentum will recover rapidly, pulling the tail back up into the leading quadrant on the daily RRG as well.
This scenario anticipates that support in price will hold up and allow the strong relative rotation on the weekly RRG to continue. With short stops and close monitoring, this is a good risk/reward situation.
-Julius
My regular blog is the RRG Charts blog. If you would like to receive a notification when a new article is published there, simply "Subscribe" with your email address.
Julius de Kempenaer
Senior Technical Analyst, StockCharts.com
Creator, Relative Rotation Graphs
Founder, RRG Research
Want to stay up to date with the latest market insights from Julius?
– Follow @RRGResearch on Twitter
– Like RRG Research on Facebook
– Follow RRG Research on LinkedIn
– Subscribe to the RRG Charts blog on StockCharts
Feedback, comments or questions are welcome at Juliusdk@stockcharts.com. I cannot promise to respond to each and every message, but I will certainly read them and, where reasonably possible, use the feedback and comments or answer questions.
To discuss RRG with me on S.C.A.N., tag me using the handle Julius_RRG.
RRG, Relative Rotation Graphs, JdK RS-Ratio, and JdK RS-Momentum are registered trademarks of RRG Research.
Julius de Kempenaer
Senior Technical Analyst, StockCharts.com
Creator, Relative Rotation Graphs
Founder, RRG Research
Host of: Sector Spotlight
Please find my handles for social media channels under the Bio below.
Feedback, comments or questions are welcome at Juliusdk@stockcharts.com. I cannot promise to respond to each and every message, but I will certainly read them and, where reasonably possible, use the feedback and comments or answer questions.
To discuss RRG with me on S.C.A.N., tag me using the handle Julius_RRG.
RRG, Relative Rotation Graphs, JdK RS-Ratio, and JdK RS-Momentum are registered trademarks of RRG Research.


