 Today we are going to show how 52-week highs and lows can be used to track long-term and short-term trends in the S&P 500. Full disclosure: this is not the holy grail. It is one indicator that can be used in conjunction with others to keep you on the right side of the trend.
52-week highs and lows are exceptional. A stock recording a 52-week high is clearly in a strong uptrend and clearly a leader. These stocks are worth counting because they contribute to broad market strength. On the other side, a stock recording a 52-week low is clearly in a strong downtrend and a laggard. Stocks in strong downtrends detract from broad market strength.
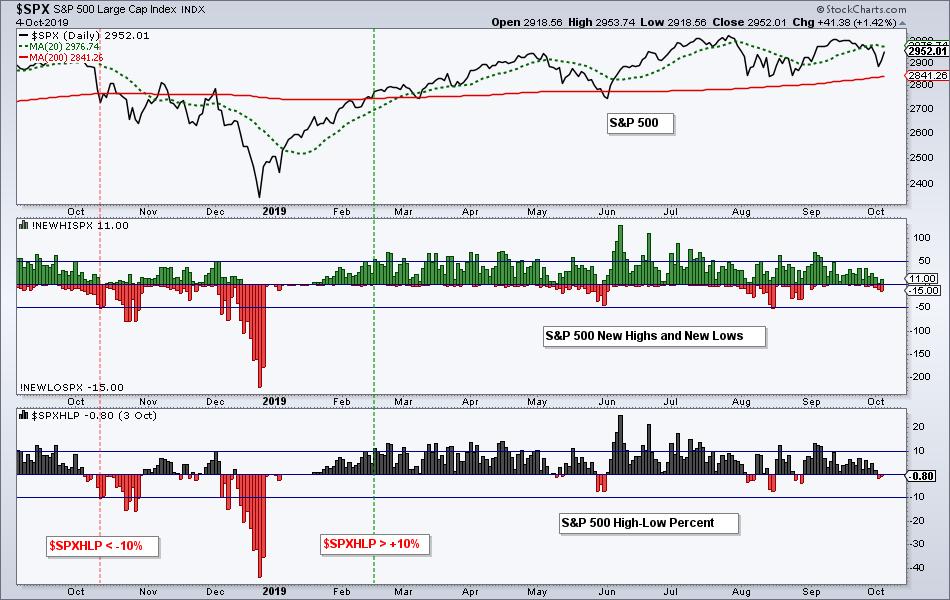
Now we need to measure "net strength" using High-Low Percent. This indicator shows net new highs (new highs less new lows) as a percentage of total issues. The chart below shows new highs and new lows for the S&P 500 in the middle window and High-Low Percent in the lower window.

As part of my Index Breadth Model, I consider a move above +10% as bullish and a move below -10% as bearish. A move above +10% shows enough "net strength" to give the bulls a clear edge, while a move below -10% gives the bears a clear edge. This indicator has been bullish since February and it would take a move below -10% to trigger bearish.
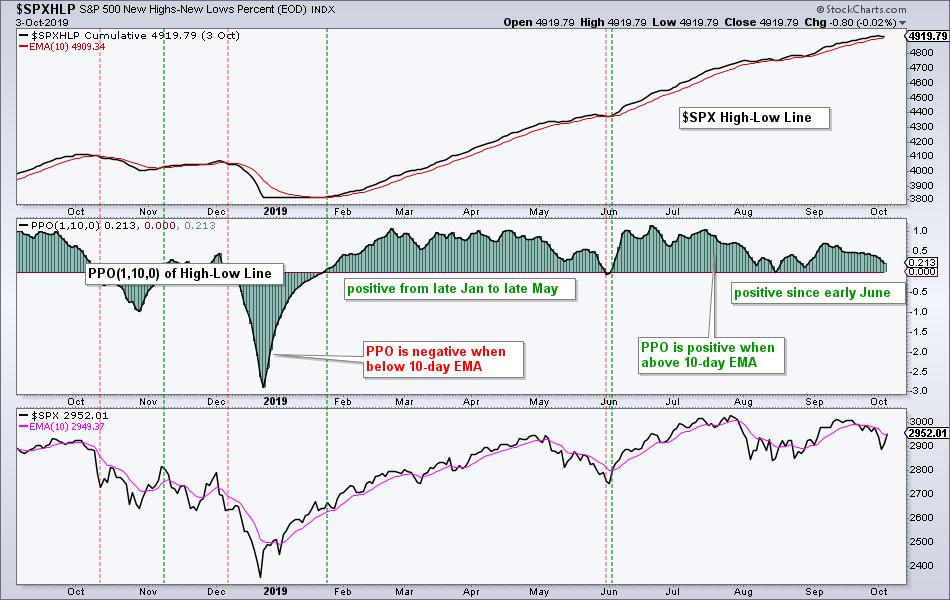
For shorter swings, chartists can apply the PPO to the High-Low Line. Like the Advance-Decline Line, this indicator is a cumulative measure of High-Low Percent. The chart below shows the High-Low Line with the 10-day EMA in the top window, the PPO of the High-Low Line and the S&P 500. The PPO(1,10,0) turns positive when the High-Low Line moves above its 10-day EMA (rising) and negative when the High-Low Line moves below its 10-day EMA.

The red and green lines mark the crosses over the past year. The PPO turned positive in early June and remains positive. Except for a short whipsaw in May-June, this line has been pretty much rising since late January. Chartists looking for an early warning signal from the S&P 500 can watch this indicator. A move below zero would signal an expansion of new lows (strong downtrends) and this would be negative for the S&P 500.
Note that these charts show Thursday's values for new highs and new lows. Simply click on the charts to open a link to a live chart with Friday's data.
Choose a Strategy, Develop a Plan and Follow a Process
Arthur Hill, CMT
Chief Technical Strategist, TrendInvestorPro.com
Author, Define the Trend and Trade the Trend
Want to stay up to date with Arthur's latest market insights?
– Follow @ArthurHill on Twitter


