Editor's Note: This article was originally published in Martin Pring's Market Roundup on Friday, November 1st at 1:36pm ET.
At Pring Turner Capital, the registered investment advisory firm where I serve as investment strategist, our investment approach involves the proactive rotation of client's assets around the business cycle. That's because every cycle goes through a chronological sequence of events, just like the calendar year transitions through four seasons. In the business cycle, we call them stages, as turning points in financial markets represent part of this sequential approach. Since there are three markets (bonds, stocks and commodities), each of which has a top and a bottom, an individual cycle experiences six stages (three times two). Just as farmers generally do not plant seeds in winter, we take measures to reduce risk and reduce our equity exposure during bear markets, lowering the overall beta level at the same time. On the other hand, the start of an equity bull market is the time to take on added risk. Our indicators identified a bull market in bonds and stocks earlier in the year; stocks have now tentatively broken to the upside. Using the sequential approach, the next event in the business cycle calendar, so far as financial market turning points are concerned, is a bottom in commodities. That will obviously be important for commodities, but even more-so for resource-based equities such as energy, mines and materials. Arguably most importantly, it will represent a signal that the economy is emerging from its 18-or-so-month slowdown, since commodity prices are very sensitive to global economic conditions. Sector leadership changes are taking place and portfolio performance will depend on identifying the emerging leaders and laggards.
Right now, the major commodity indexes are trading below their 12-month MAs and experiencing a bearish long-term KST. As long as those conditions remain in force, count me as a bear. That said, there are some potentially bullish signs that lead me to believe commodity prices may be in the process of bottoming.
First, Chart 1 shows that the Coppock Curve for the CRB Composite has started to turn up. The solid green arrows show valid signals, while the three dashed ones show failed ones. What I conclude from this is that the Coppock reversal is an encouraging factor, but we really need to see some confirmation from the CRB itself in the form of some trend reversal evidence. In effect, we need something to tip the balance in a bullish way.
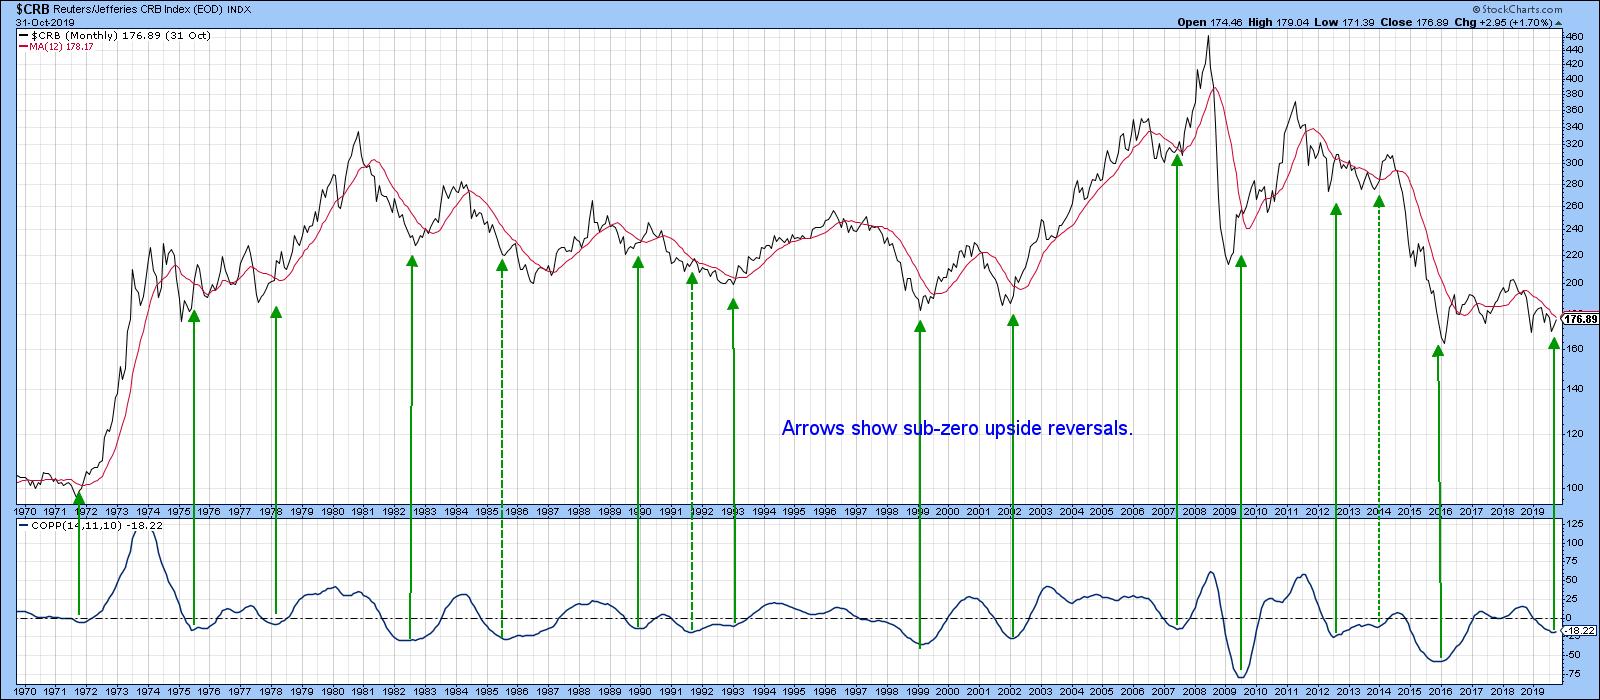
Chart 1
The obvious point would be a break above the dashed green 2014-19 downtrend line for the CRB Composite in Chart 2, which has started to happen in an anemic way. The connection between the CRB and the Canadian dollar is also featured in the chart. It also looks as if the currency has broken out. If that does prove to be the case, the implied strength in the dollar will result in a KST buy signal. The arrows show that previous such signals were followed by a very significant commodity rally.
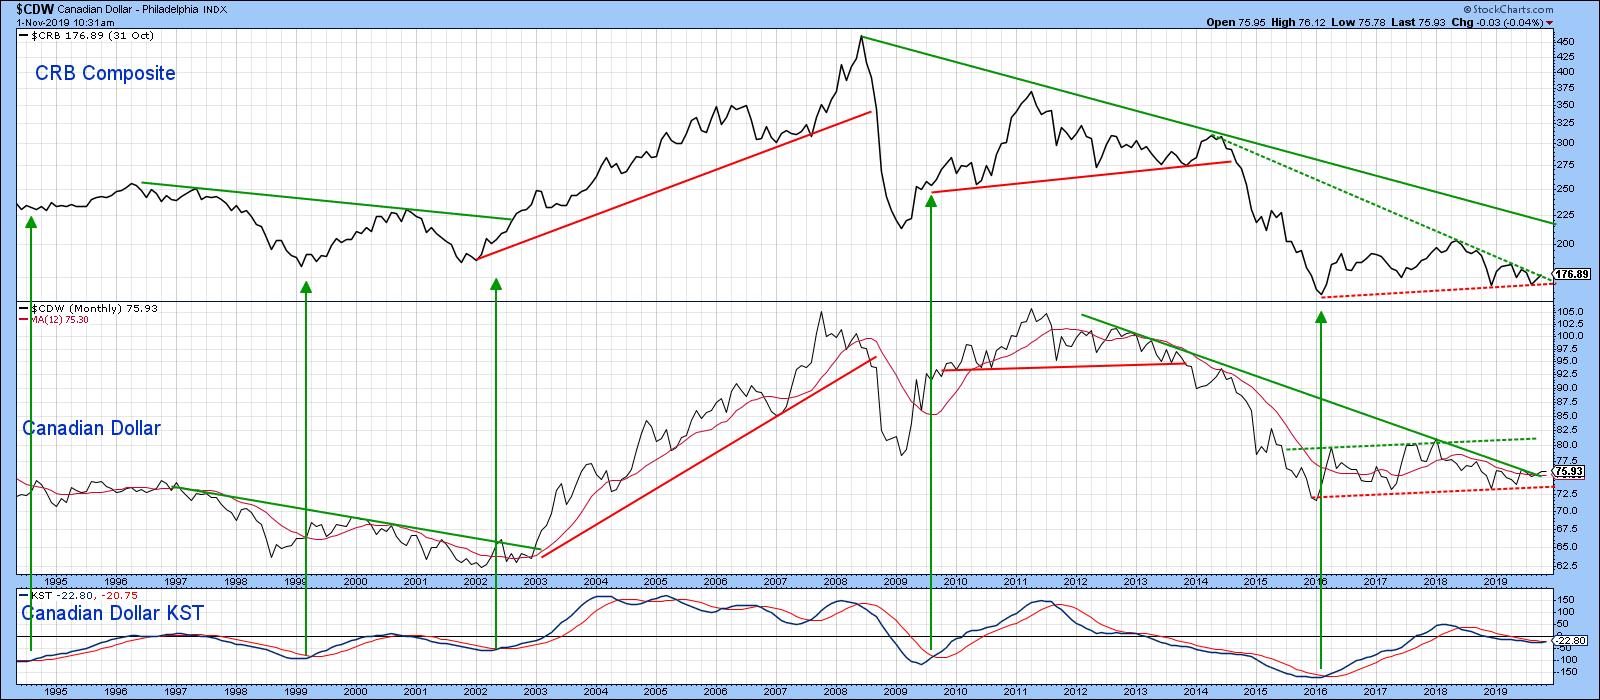
Chart 2
Good luck and good charting,
Martin J. Pring
The views expressed in this article are those of the author and do not necessarily reflect the position or opinion of Pring Turner Capital Group of Walnut Creek or its affiliates.


