This week, we rolled out new data coverage for the crypto market, with real-time prices updated 24/7 and full integration into all of the tools and features you know and love on StockCharts. You can now create advanced technical charts for Bitcoin, Ethereum, Litecoin, XRP, Monero and many more. Plus, run custom technical scans across all cryptos and set automatic alerts for the coins you're following most closely.
As you can imagine, data coverage is an ever-expanding puzzle. Adding crypto data is the newest piece, and we're thrilled to bring it to the site. The market for digital assets has continued to grow steadily over the past few years and is becoming an increasingly important piece of the global financial machine. We've been keeping a close eye on it, and it's clear that the time is right to add this thriving new asset class to StockCharts.
So, where you can you find, track, chart and analyze all of this new crypto data? Let's take a look!
Your Members Dashboard
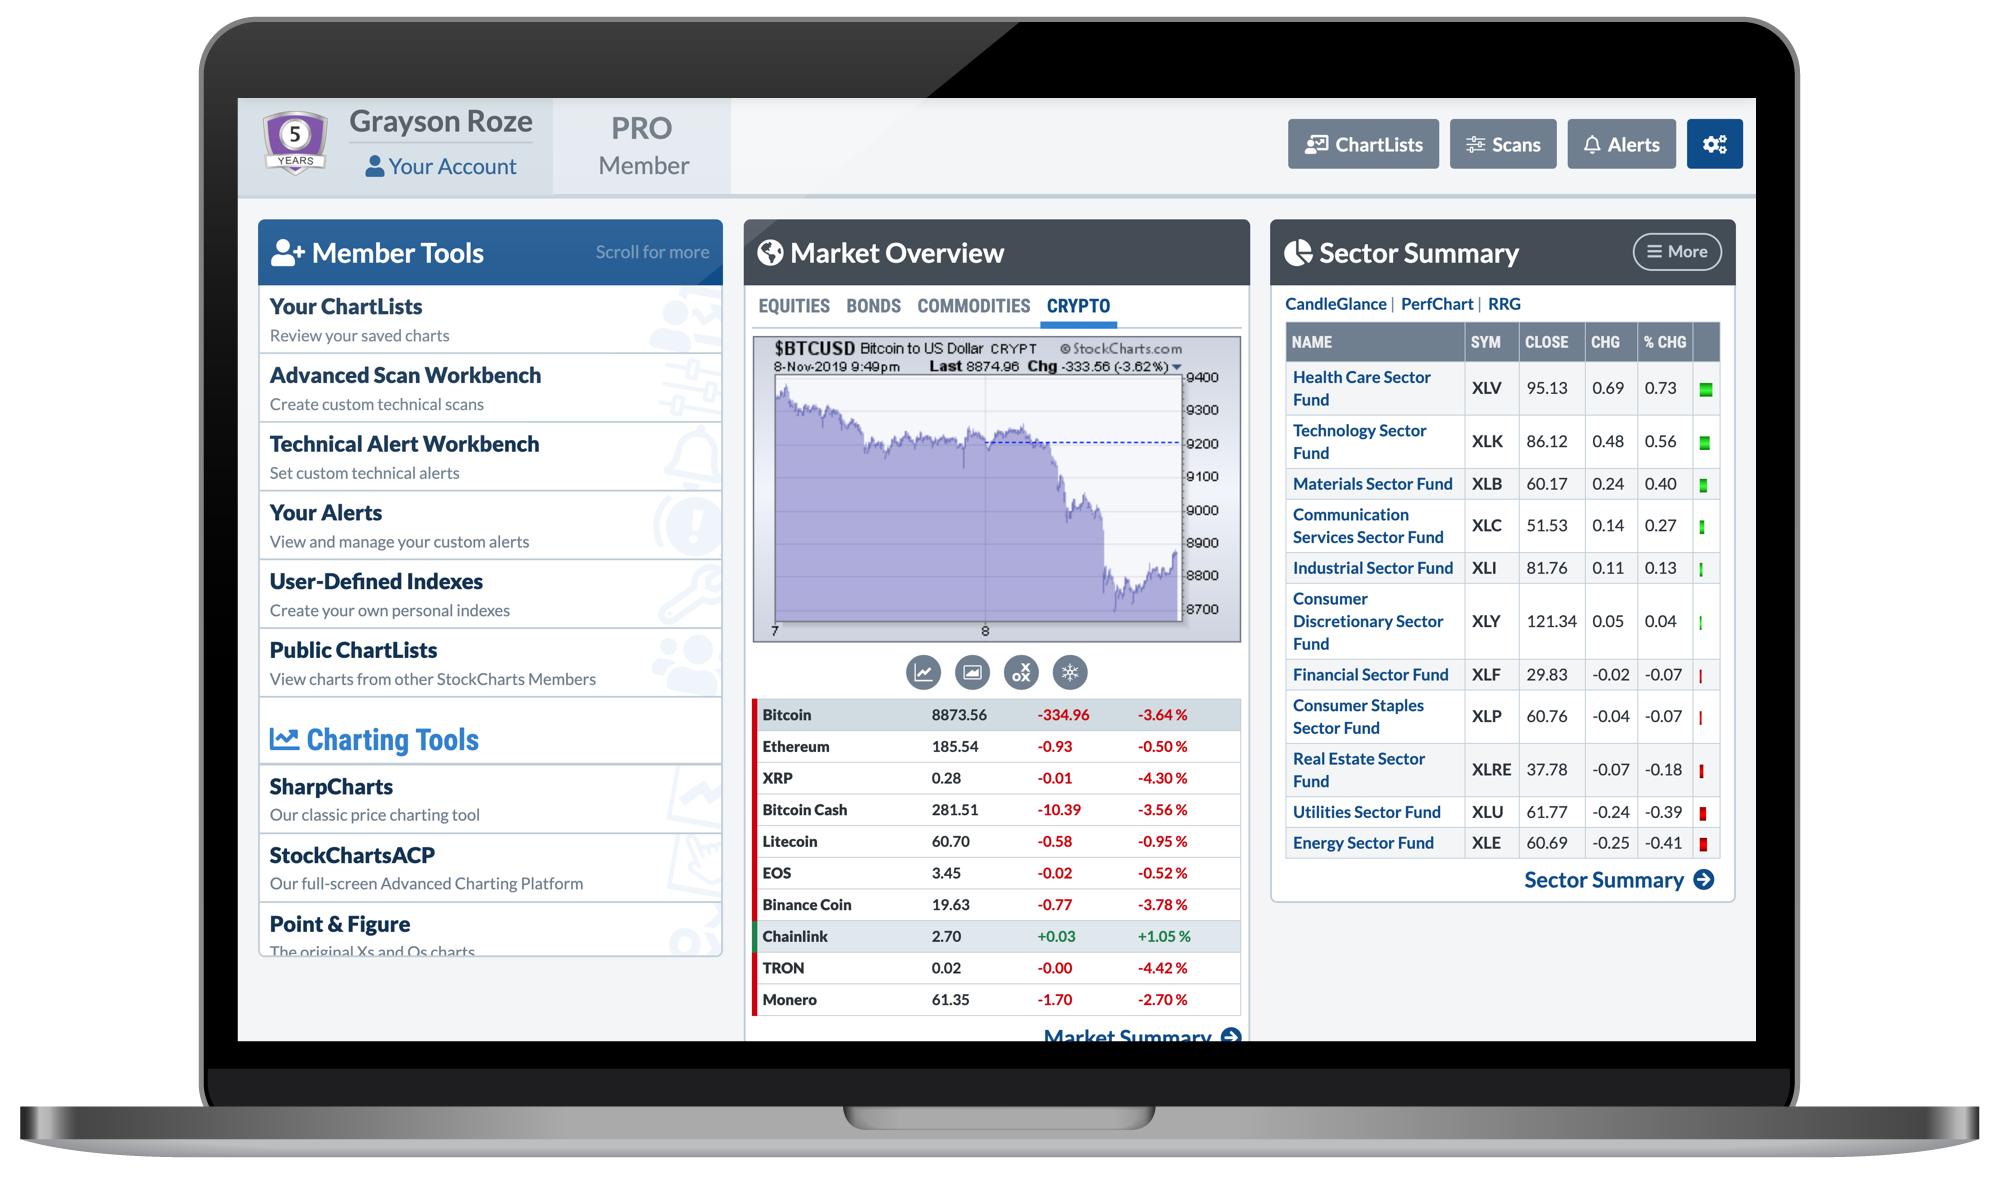
We'll start with my personal favorite. We've updated the "Market Overview" panel of Your Dashboard with three new tabs. In addition to Equities, you now have a Bonds tab, a Commodities tab and an all-new Crypto tab, which features 10 of the largest cryptos in circulation. With a single click over to this tab, you can follow which of the big coins are moving the market, with the latest performance data and charts for each one.
The Dashboard has received quite a few updates and improvements lately, and the new Crypto tab is the latest example. If you missed our announcement from a few weeks ago about the latest Dashboard changes, Click Here to take a look.
The Market Summary Page
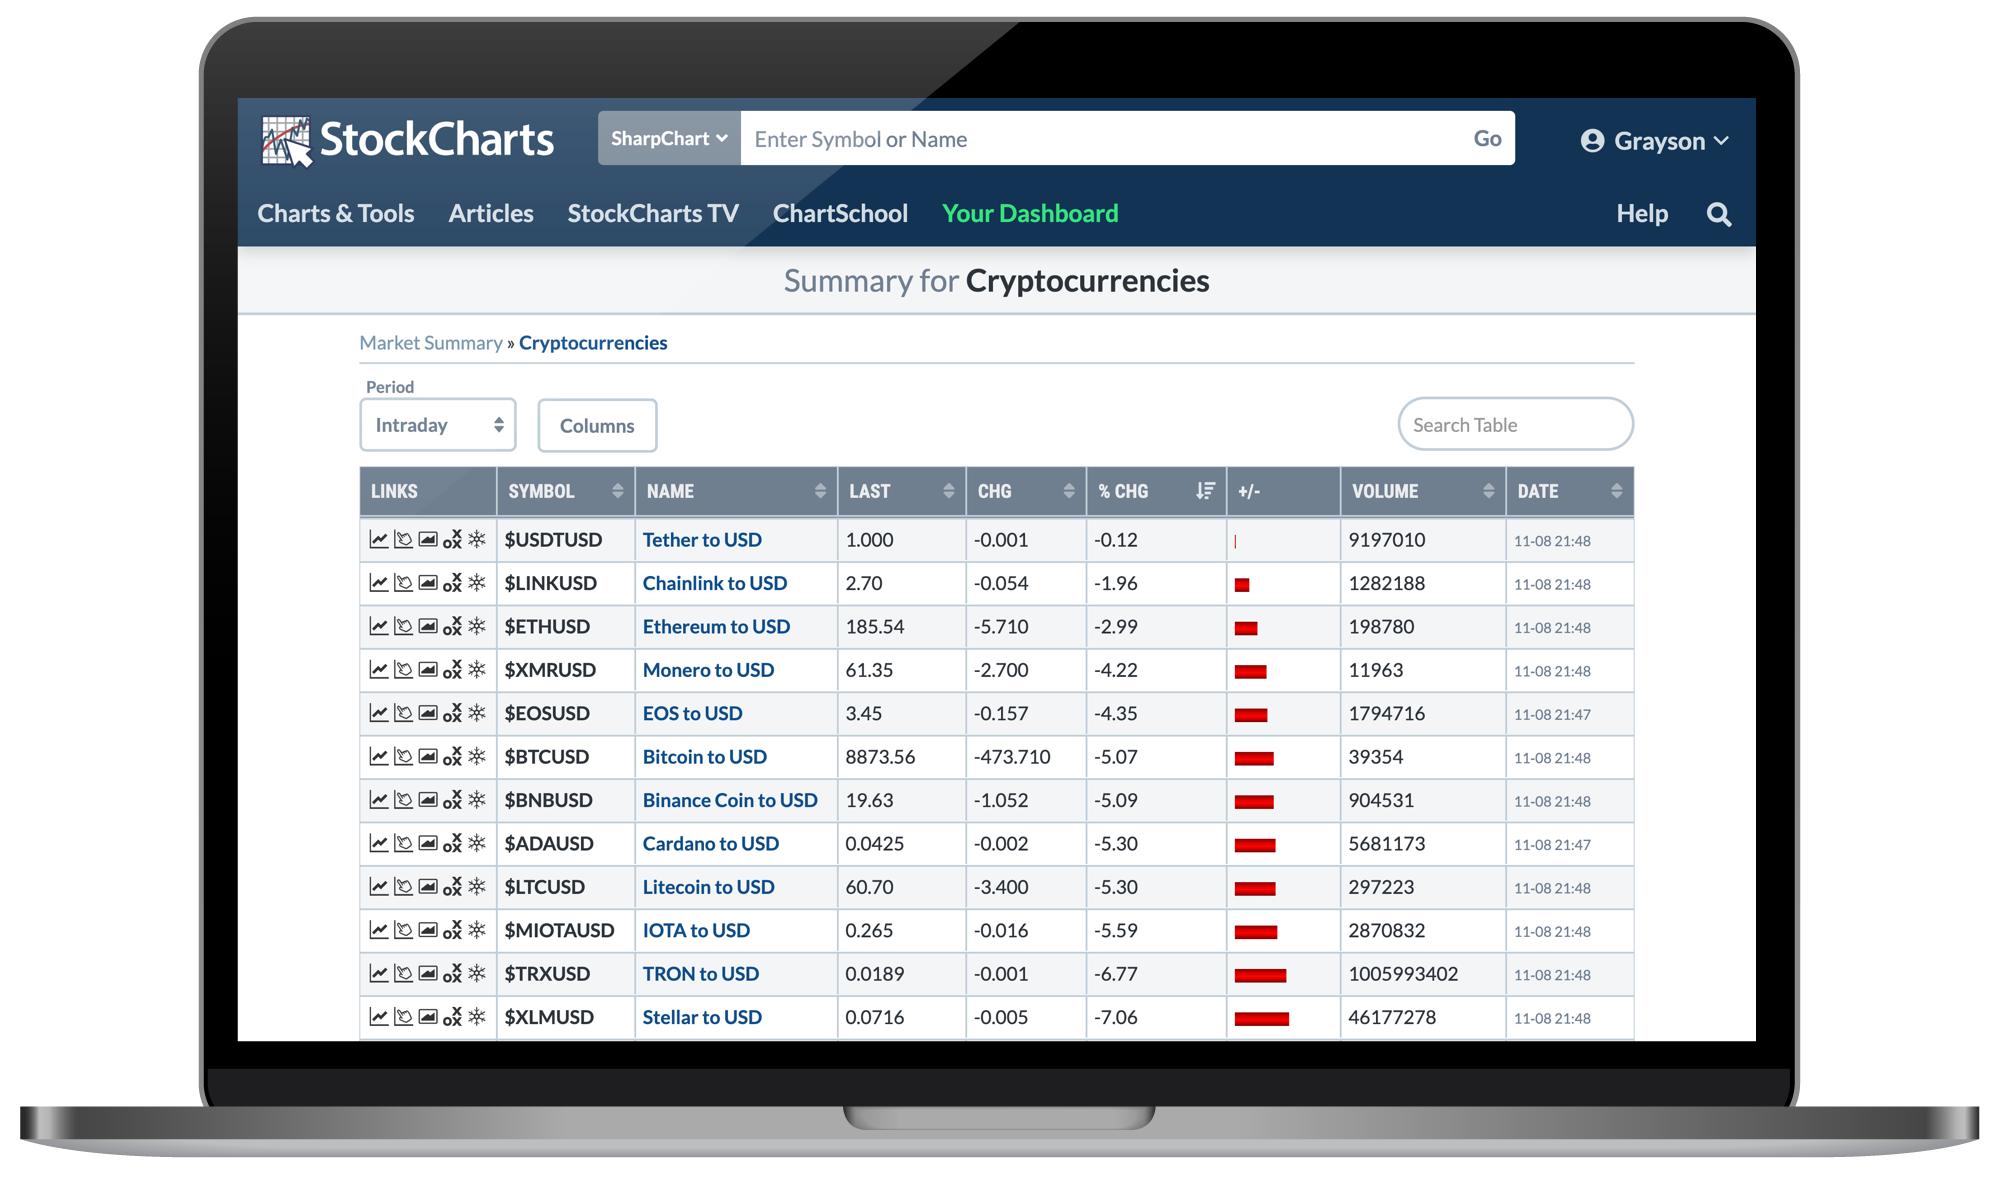
On our Market Summary page, we've now added a Cryptocurrencies section to match the other important groups and asset classes. You'll find the new group listed below the "US Commodities" summary about half way down the page.
As a reminder, you can access the Market Summary page from the Member Tools panel of Your Dashboard, or from the Charts & Tools page if you're not a StockCharts Member.
QUICK TIP: As a StockCharts Member, you can customize the charts you see on the Market Summary page with the indicators, overlays and settings you prefer. For detailed instructions, Click Here.
Our NEW "Crypto Summary" Page
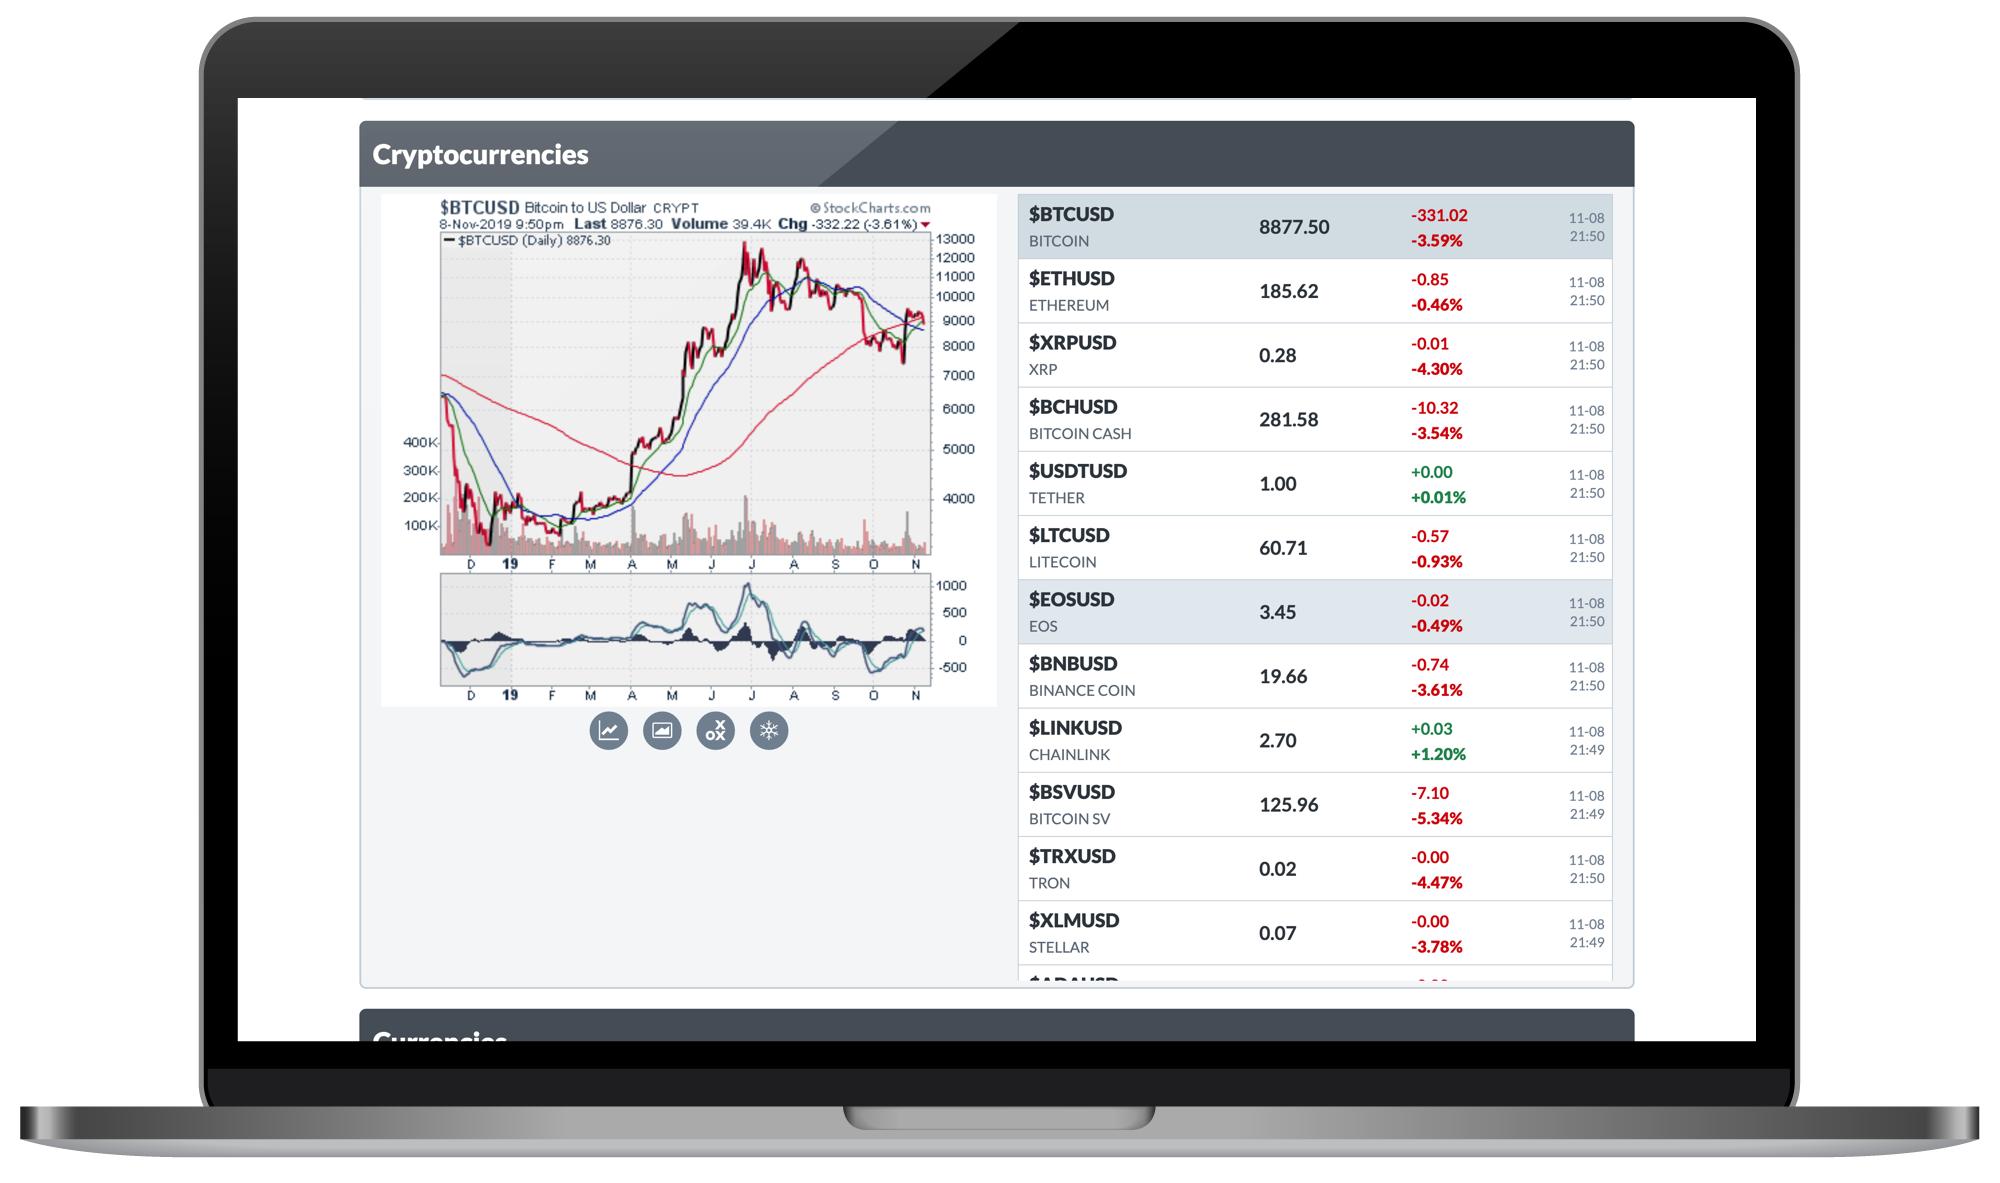
For those of you looking for a more focused summary of what's happening in the crypto space, we've also created a dedicated Crypto Summary page just for this group. In addition to the latest performance data for each coin we cover, the summary page includes quick links to all of our most powerful charting tools, allowing you to pull up charts for each crypto with ease.
You can quickly access our new Crypto Summary page from the Member Tools panel of Your Dashboard, from the Charts & Tools page if you're not a StockCharts Member, or simply by visiting StockCharts.com/crypto.
StockChartsACP – Our Advanced Charting Platform
You've probably heard the buzz surrounding our new full-screen, interactive Advanced Charting Platform – StockChartsACP. With an ultra-dynamic, highly-flexible charting experience, it's designed to totally transform the way you analyze the financial markets. Most importantly, it's the next generation of StockCharts technology and represents multiple years of hard work by our incredible development team.
We're so excited about this new tool that we simply couldn't wait to share it with all of you. That's why earlier this year we decided to release an early-stage alpha version of the new ACP tool. Rather than keep everything under wraps, we wanted to give our loyal users the opportunity to see and explore the upcoming product. We've continued to update that preview version every Friday with updates, improvements, new features and more. It's all leading up to the big official release of the full-featured Advanced Charting Platform in early 2020.
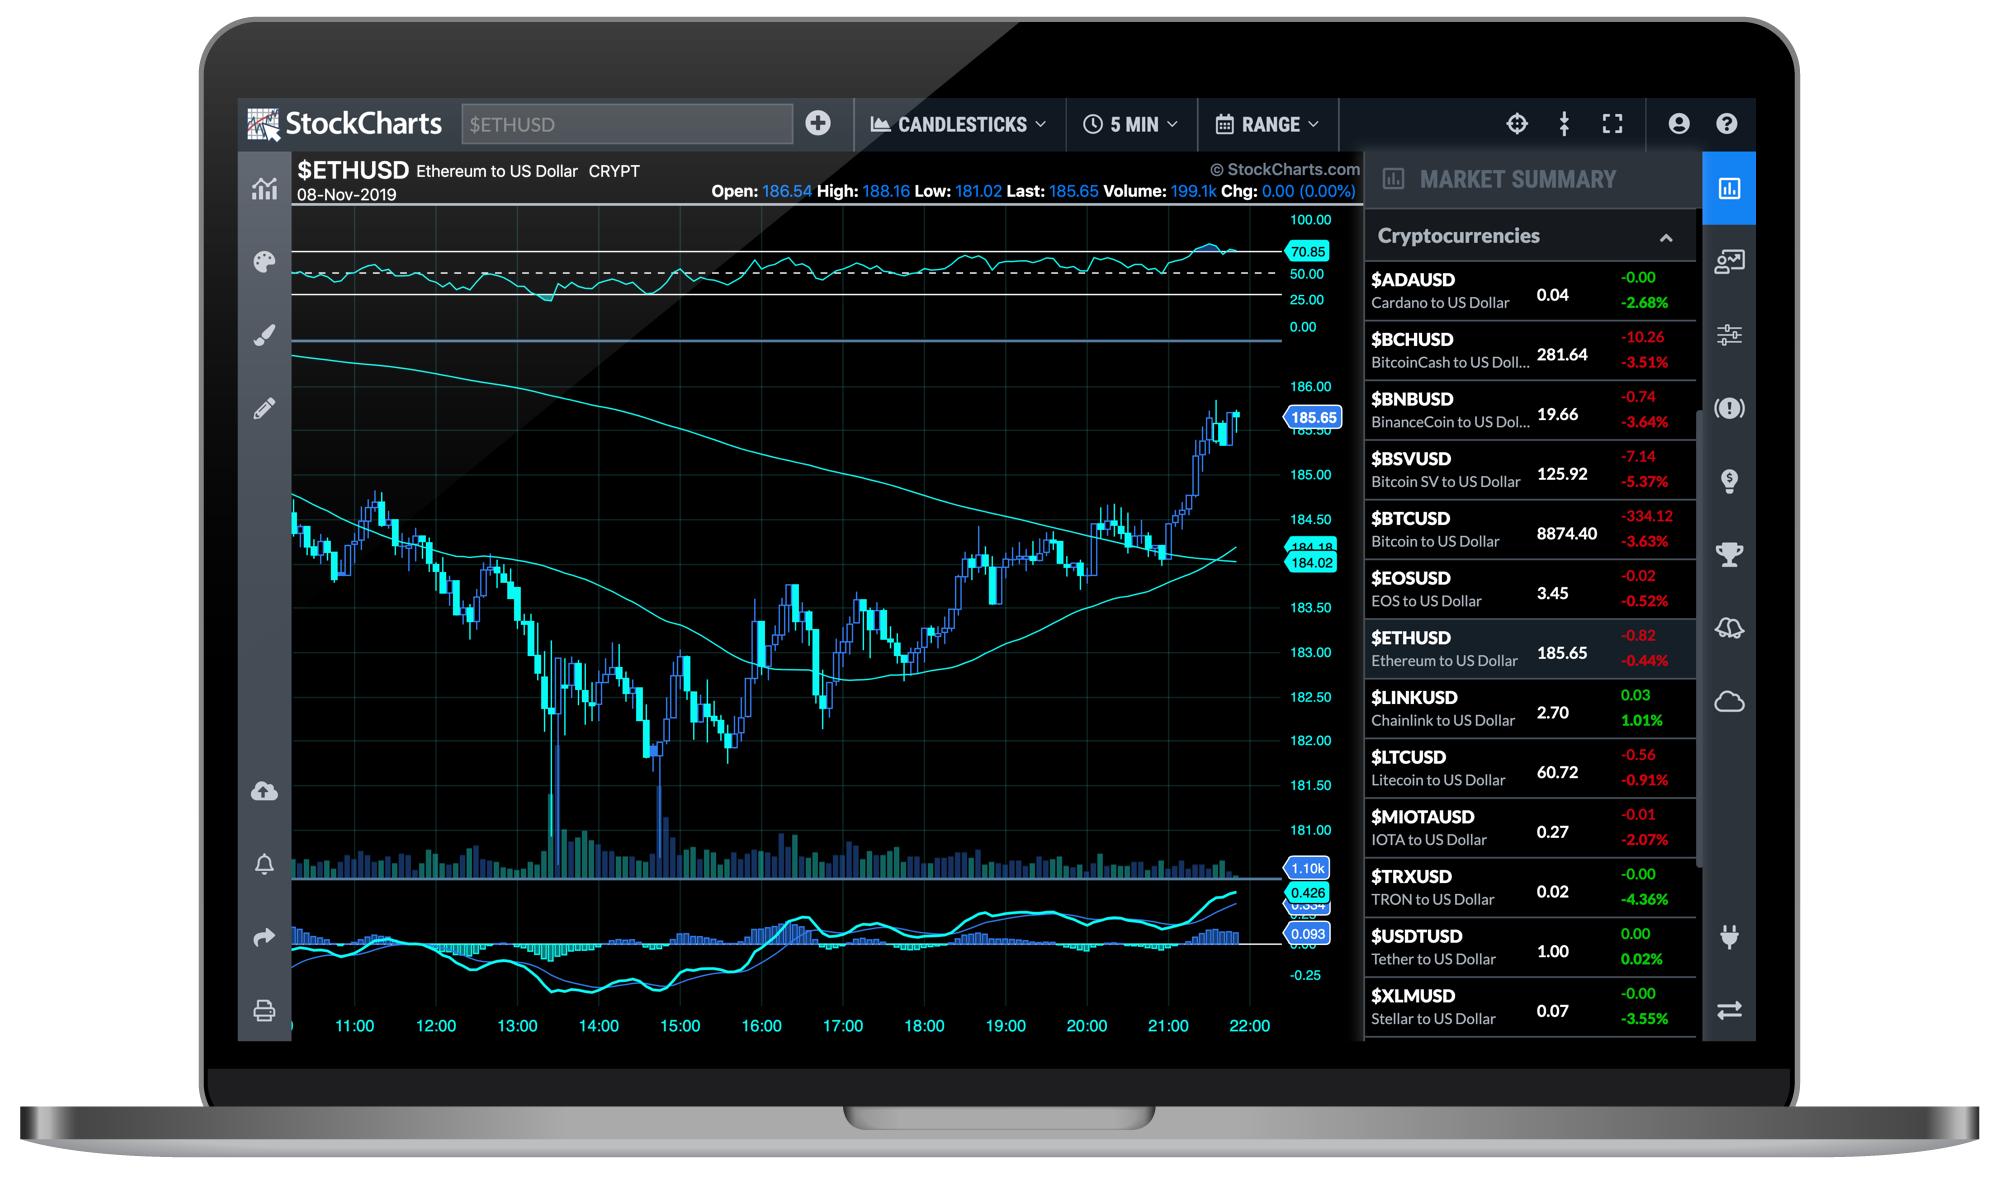
So, with the addition of crypto coverage this week, we've started incorporating the new data into ACP. If you open the Market Summary menu in the righthand sidebar of ACP, you'll see the Cryptocurrencies group listed there. Click on any of the cryptos in that list to see an ACP chart for that coin.
Personally, I'm thrilled about the addition of crypto data on its own, but in concert with the ongoing rollout of our new Advanced Charting Platform, the excitement has only just begun. We have big, big things in store for these two together, and I simply can't wait to share it with you all.
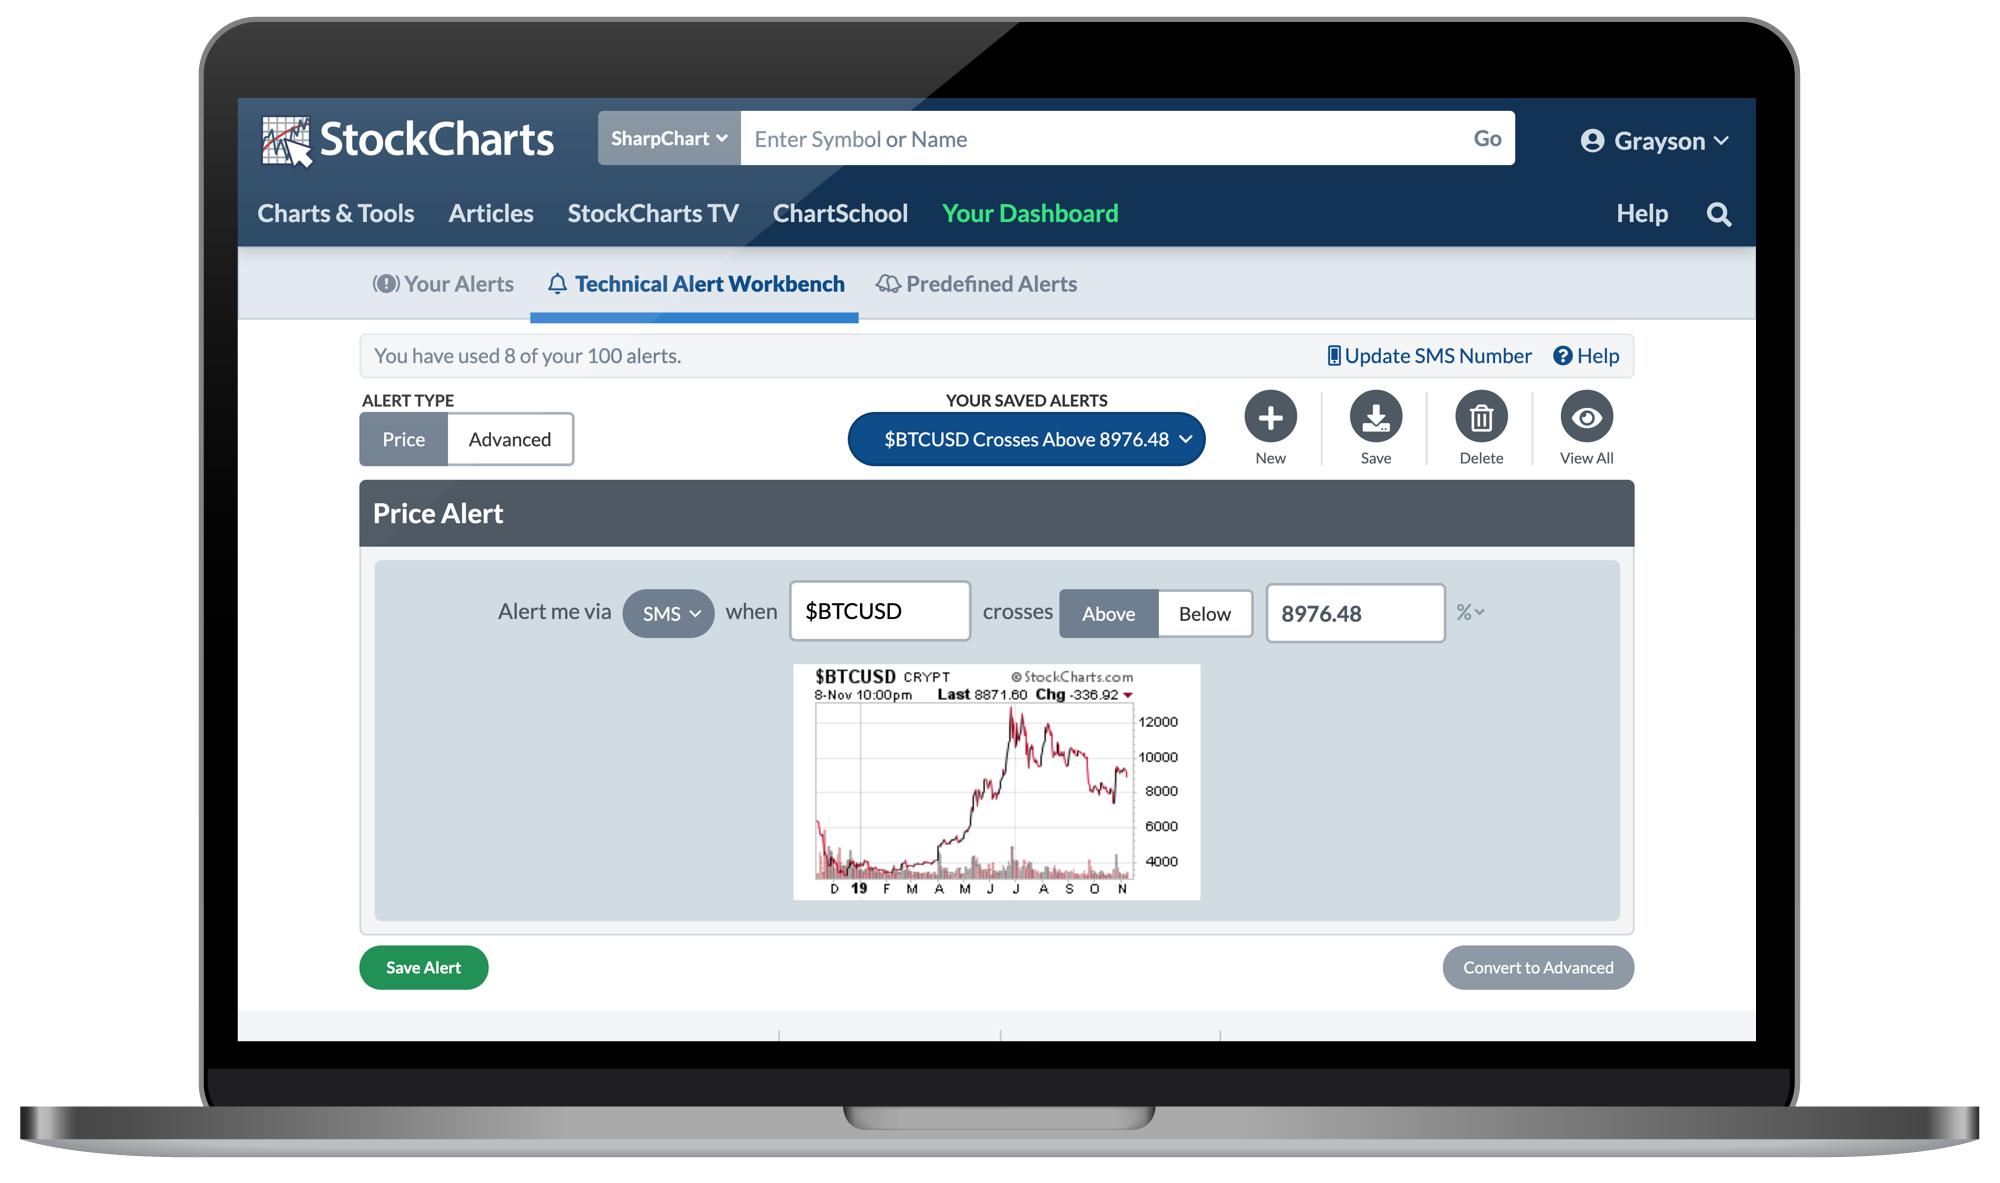
Scans And Alerts
We've wired the new cryptos into both the Advanced Scan Engine and our Technical Alerts tools. You can run scans for your own technical criteria across all of the cryptos we cover, and set custom alerts for the coins you're following most closely. For a market that trades 24 hours a day, 7 days a week, these scanning and alerts capabilities should be a crucial part of any crypto investor's workflow.
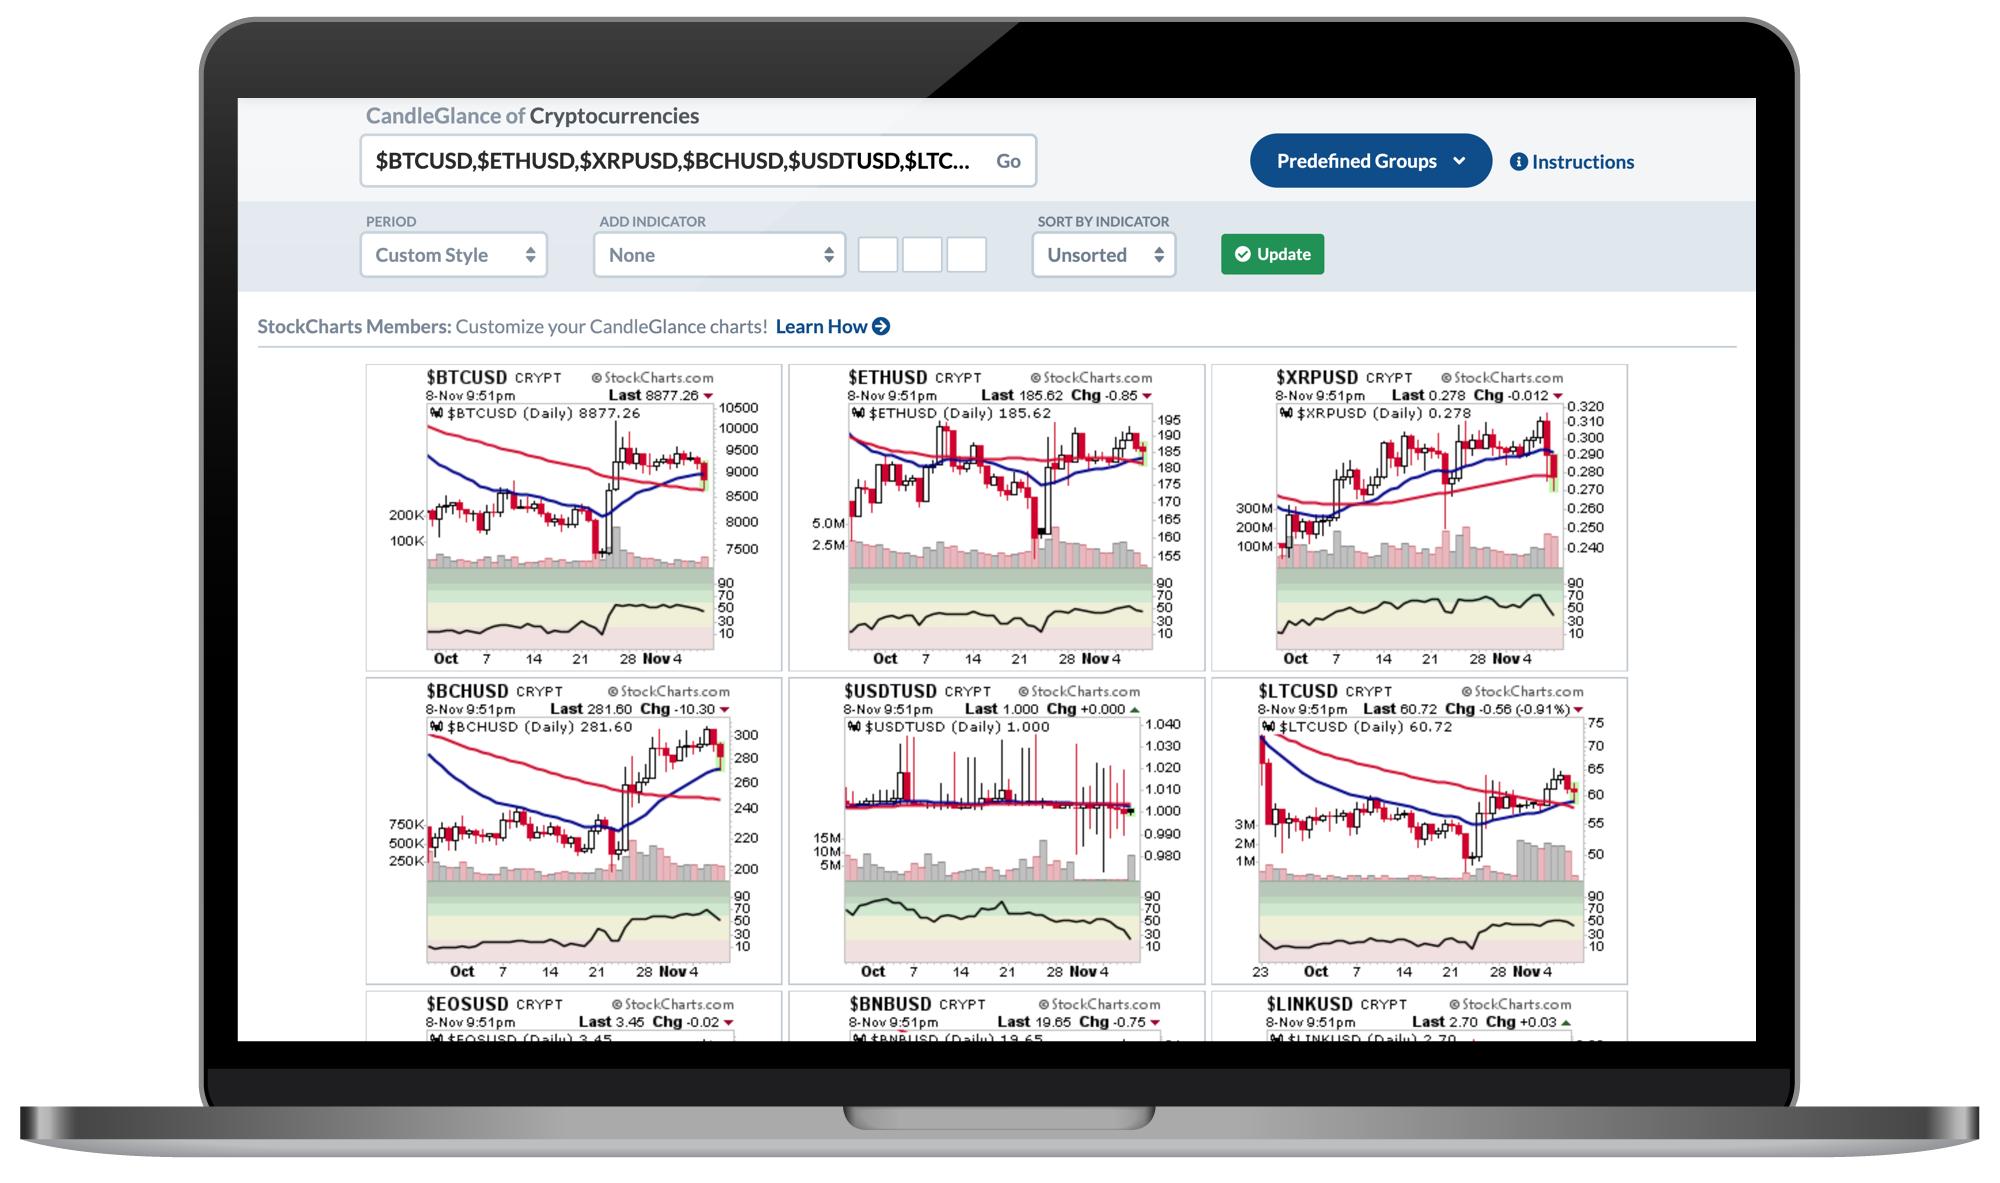
Predefined Groups for CandleGlance, PerfCharts and MarketCarpets
Within our CandleGlance, PerfCharts and MarketCarpets tools, you'll now find a predefined "Cryptocurrencies" group that includes the largest coins we cover. No need to type in all of the ticker symbols by hand. Simply look for the blue "Predefined Groups" dropdown menu and select the Cryptocurrencies option. Quick 'n easy!
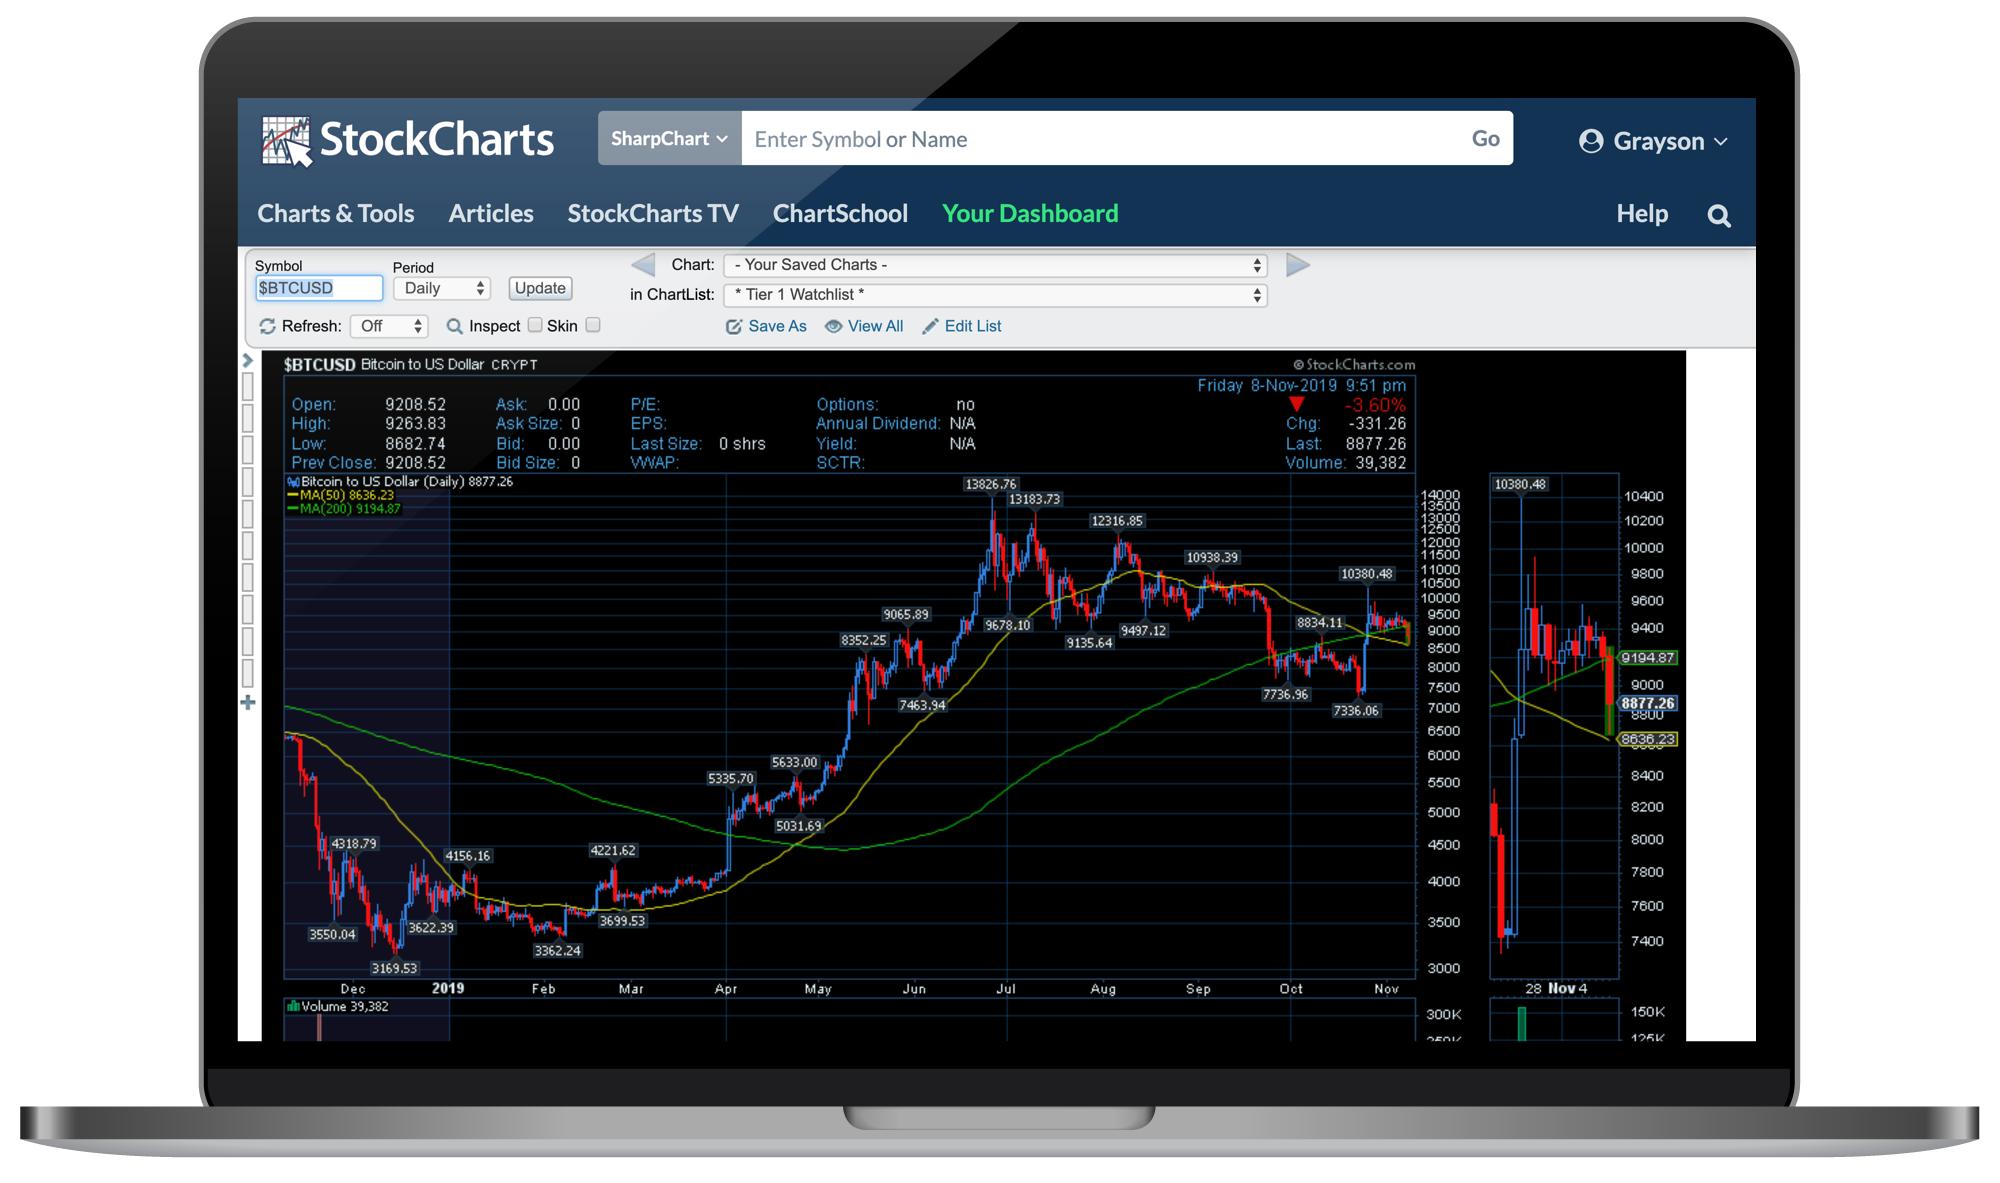
And Of Course...SharpCharts!
Just like any stock, ETF, Mutual Fund or index we cover, all of our new cryptocurrencies can be charted on the SharpCharts workbench. Using the same technical indicators, overlays, chart settings and annotation tools you're already familiar with, you can analyze the crypto market like never before with the addition of this new data across the site. Plus, just like any other symbol, you can save your charts for these cryptos into your ChartLists, view them with CandleGlance and GalleryView, run scans on them, set alerts for them...the list goes on and on. When I said cryptos are here, I really meant it – cryptos are here!
As with any new feature or addition, we'd love to hear from you. Let us know what you think about the addition of crypto data and share how you're using these new symbols around the site! We appreciate your feedback and input and always love learning more about your experience using StockCharts.
Chart On, My Friends.
Grayson Roze
VP of Operations, StockCharts.com
Chart on, my friends.
Grayson Roze
- Director of Operations, StockCharts.com
- Author, Trading For Dummies (Wiley, 2023)
- Author, Tensile Trading: The 10 Essential Stages of Stock Market Mastery (Wiley, 2016)
- Co-Founder, StockMarketMastery.com
- Twitter: @GraysonRoze