 The Nasdaq AD Line is not keeping pace with the Nasdaq Composite, but this is not bearish for the Nasdaq or the market as a whole. Note that the Nasdaq hit a new high in July and again on November 1st, even though the Nasdaq AD Line has been falling since April. How can this be, what does it tell us and why is it not bearish? Let's address this questions.
First and foremost, note that the Nasdaq has some 3200 listed stocks ($NATOT) and the listing requirements are not as stringent as they are on the NYSE ($NYTOT). This means there are quite a few "questionable" listings on the Nasdaq and this is reflected in the AD Line. All stocks are equal in the eyes of the AD Line because an advance counts as +1 and a decline counts at -1, regardless of market cap or listing quality. This means an advance in AAPL counts the same as an advance in Ruhnn Holdings (RUHN), which is a Chinese listing with a market cap of $454 million. You may want to watch "The China Hustle" before you consider investing in RUHN.
The chart below shows the Nasdaq, the Nasdaq AD Line and the NYSE AD Line. The Nasdaq AD Line is currently near its 2010 peak and has pretty much moved sideways for 10 years. In contrast, the Nasdaq is up over 200% the last ten years and the NYSE AD Line shows a consistent rise. The Nasdaq Composite is a market cap weighted index where the biggest stocks drive the index. Thus, the index can, and often does, rise on days when declines outpace advances.
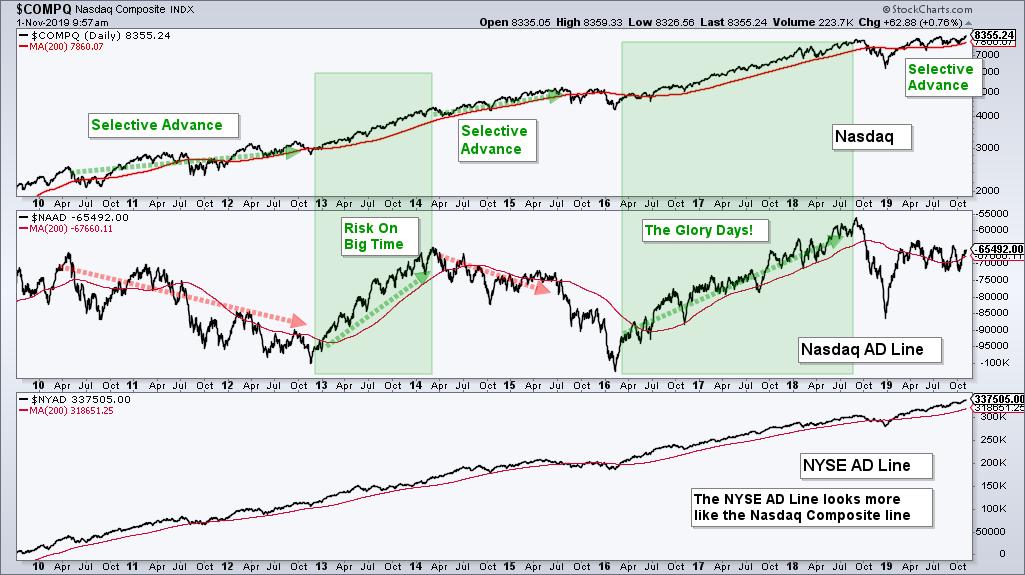
The Nasdaq AD Line is not useless though. Because of the relatively easy listing requirements, the AD Line provides a good litmus tests for the risk appetite in the stock market. There are basically two types of advances in the Nasdaq Composite: selective advances and indiscriminate advances.
The market is more selective when the Nasdaq AD Line declines and the Nasdaq rises, which occurred from 2010 to 2012, April 2014 to March 2016 and over the last six months. The market is more indiscriminate (risk on big time) when the AD Line and the Nasdaq are rising together, which occurred in 2013 and from March 2016 to August 2018. These were the glory days! Almost everything went up and everyone looked like a genius.
We are currently in a selective advance because the Advance-Decline Line is not keeping pace. This is not bearish because for the market as a whole and or for the Nasdaq Composite because the Nasdaq price chart sports a bullish continuation pattern and the AD Volume Line is keeping pace. See this extended analysis in a free article on TrendInvestorPro.com.
Videos are back!
Subscribers to TrendInvestorPro have access to an ETF ChartBook featuring 60 Core ETF charts with annotations and comments. There is also an accompanying video on Saturdays covering these 60 ETFs, which includes QQQ, IPAY, GLD, GDX and TLT. Subscribe today for immediate access.
Choose a Strategy, Develop a Plan and Follow a Process
Arthur Hill, CMT
Chief Technical Strategist, TrendInvestorPro.com
Author, Define the Trend and Trade the Trend
Want to stay up to date with Arthur's latest market insights?
– Follow @ArthurHill on Twitter


