Editor's Note: This article was originally published in Martin Pring's Market Roundup on Thursday, November 28th at 4:08pm ET.
Chart 3 shows a long-term indicator that just went bullish for the market. It also points us in the direction of one of the sectors referred to in the title of this article, namely financials. The indicator in question is the long-term KST for the relative action of the SPDR Financials (XLF). The green-shaded areas begin when it crosses above its 26-week EMA and end when it moves back below it. If you look at the progress of the SPY in the upper window, you will see that it is typically in a bullish mode when in the "green." On the other hand, practically all of the declines developed in the unshaded areas, where financials were underperforming. Since the KST has just crossed above its EMA, it has just flashed another buy signal. That makes financials one of our choices as a potential market leader.
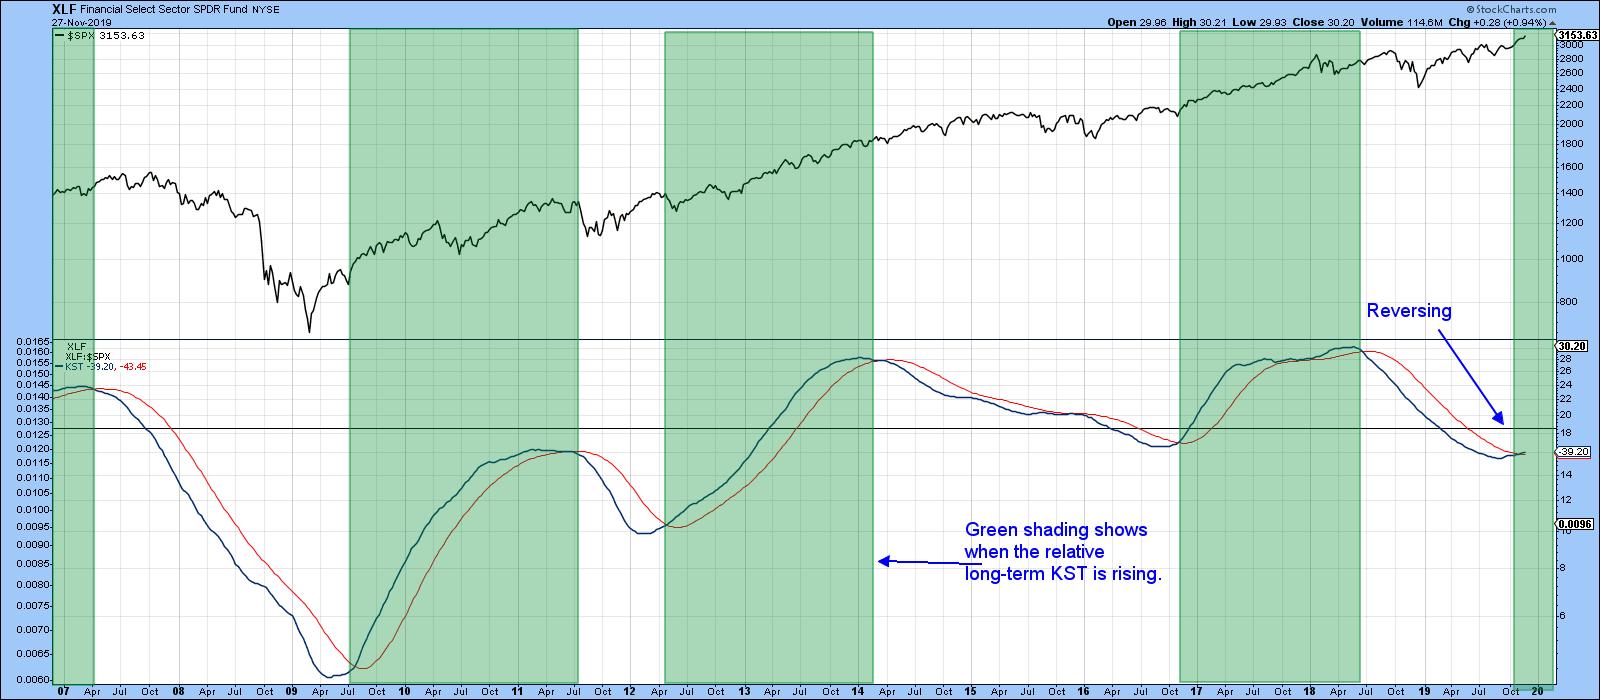
Chart 3
Chart 4 features the iShares Dow Jones Financial Services ETF (IYG). It, like the S&P itself, has emerged from a two-year consolidation, but we also see that the RS line has as well.
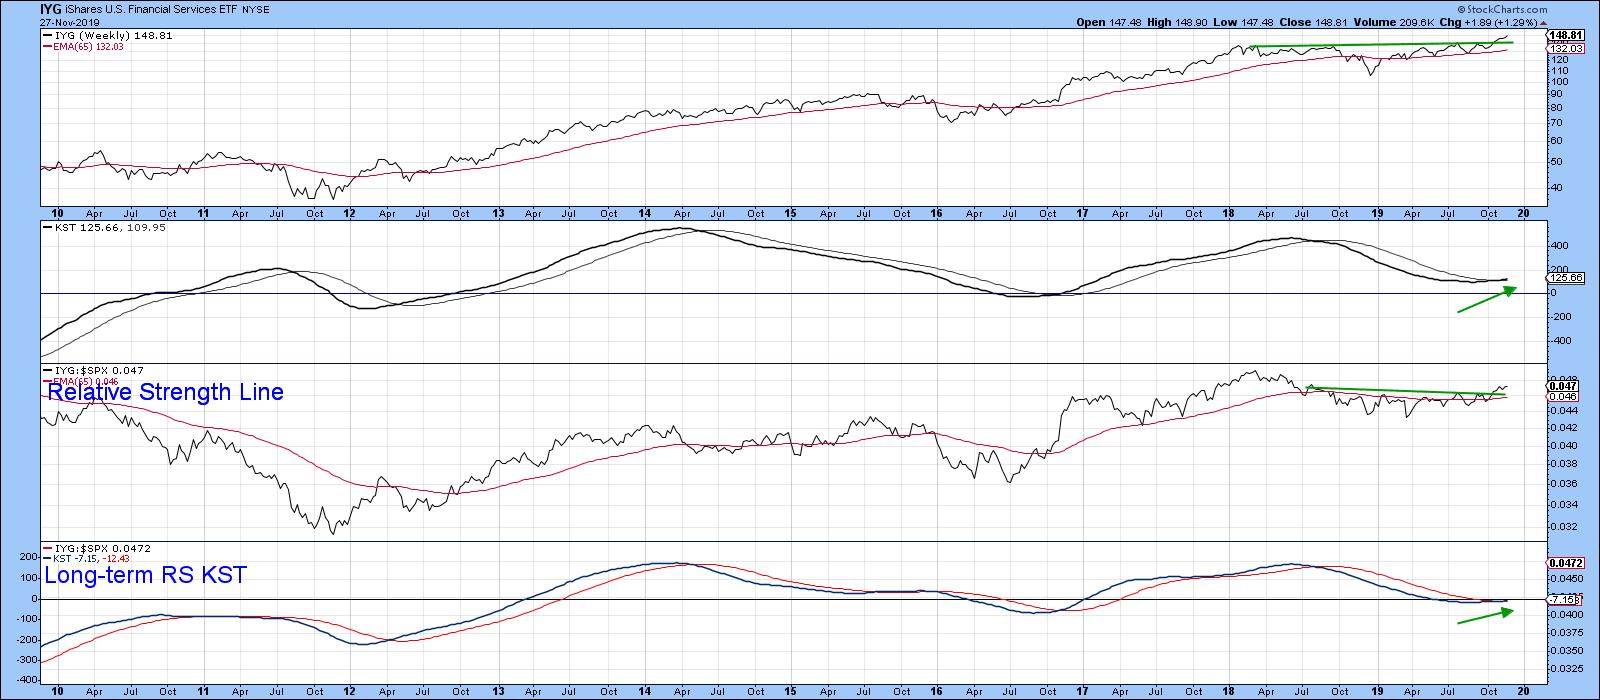
Chart 4
Industrials also look promising. Here, we have two principal contenders, the iShares Dow Jones Industrials (IYJ) and the SPDR Industrials (XLI). I prefer the IYJ, as it's a purer play on industrials. That compares to the XLI, which also includes transports, which tend to be early cycle leaders. Pure industrials are not.
Chart 5 shows that the IYJ has broken to the upside, while its RS line, though close, is contained in a trading range. However, the bullish KST for relative action suggests that it soon will.
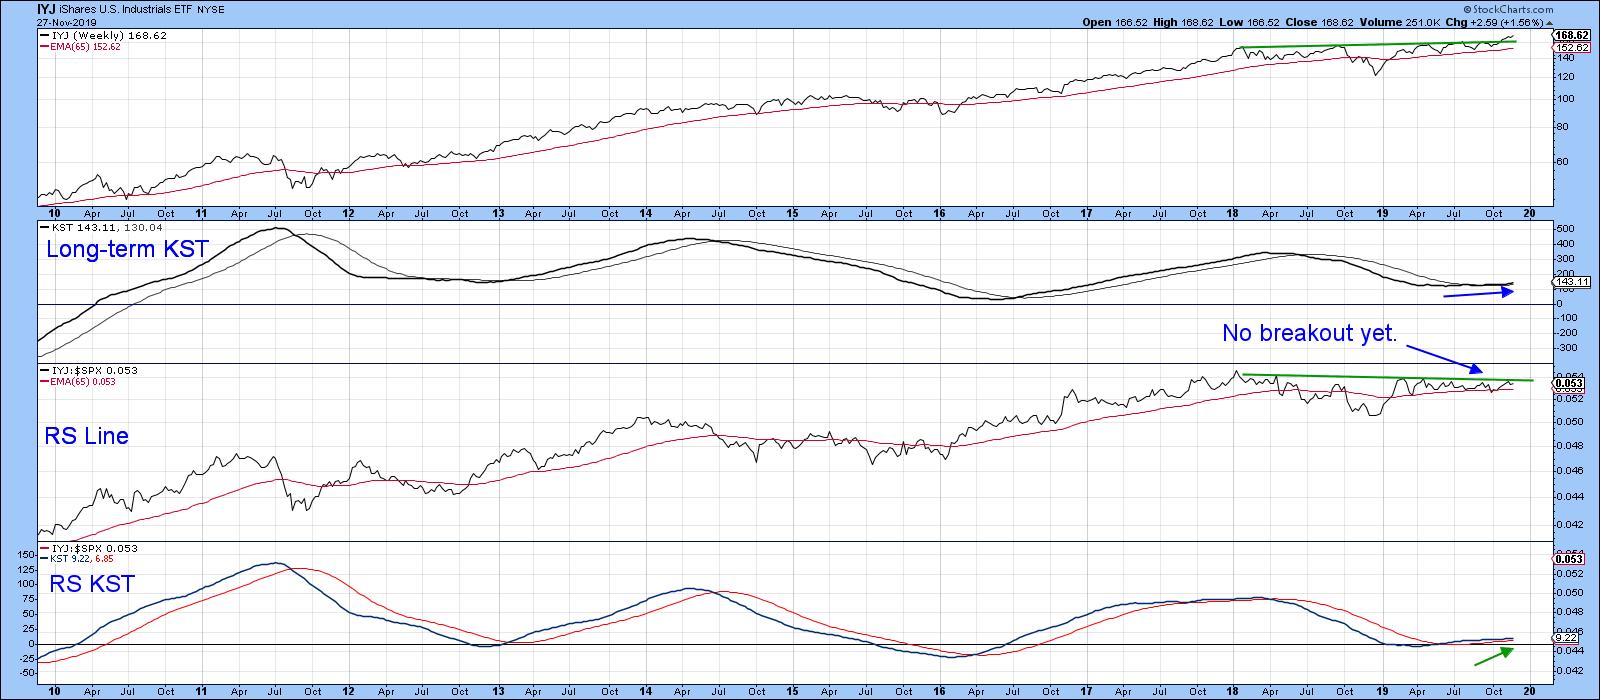
Chart 5
One industrial ETF that has broken out on both an absolute and relative basis is the Invesco Equal Weight Industrials (RGI). It looks to be the most promising of all, as shown in Chart 6.
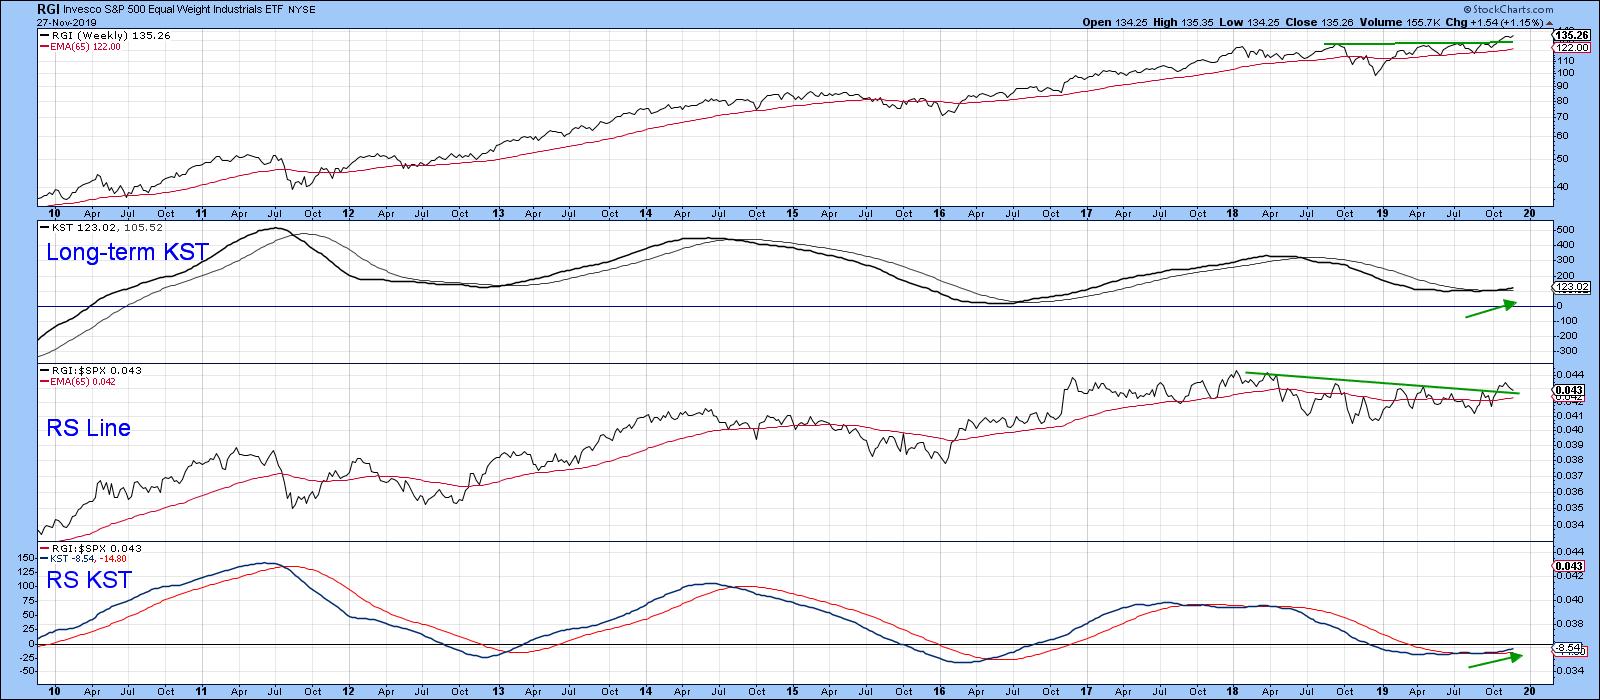
Chart 6
An industry (as opposed to sector) ETF that has recently got my attention is the Invesco Shipping ETF (SEA). Both the price and the RS line have been in a long-term downtrend, which may be coming to an end. That view is based on the fact that the price has broken out from a small base, i.e. above the dashed trend line, and its 2014-19 downtrend line. Relative action has already violated its equivalent trend line, but has not quite cleared its 65-week EMA. Since both long-term KSTs are positive, it seems a likely bet that it soon will.
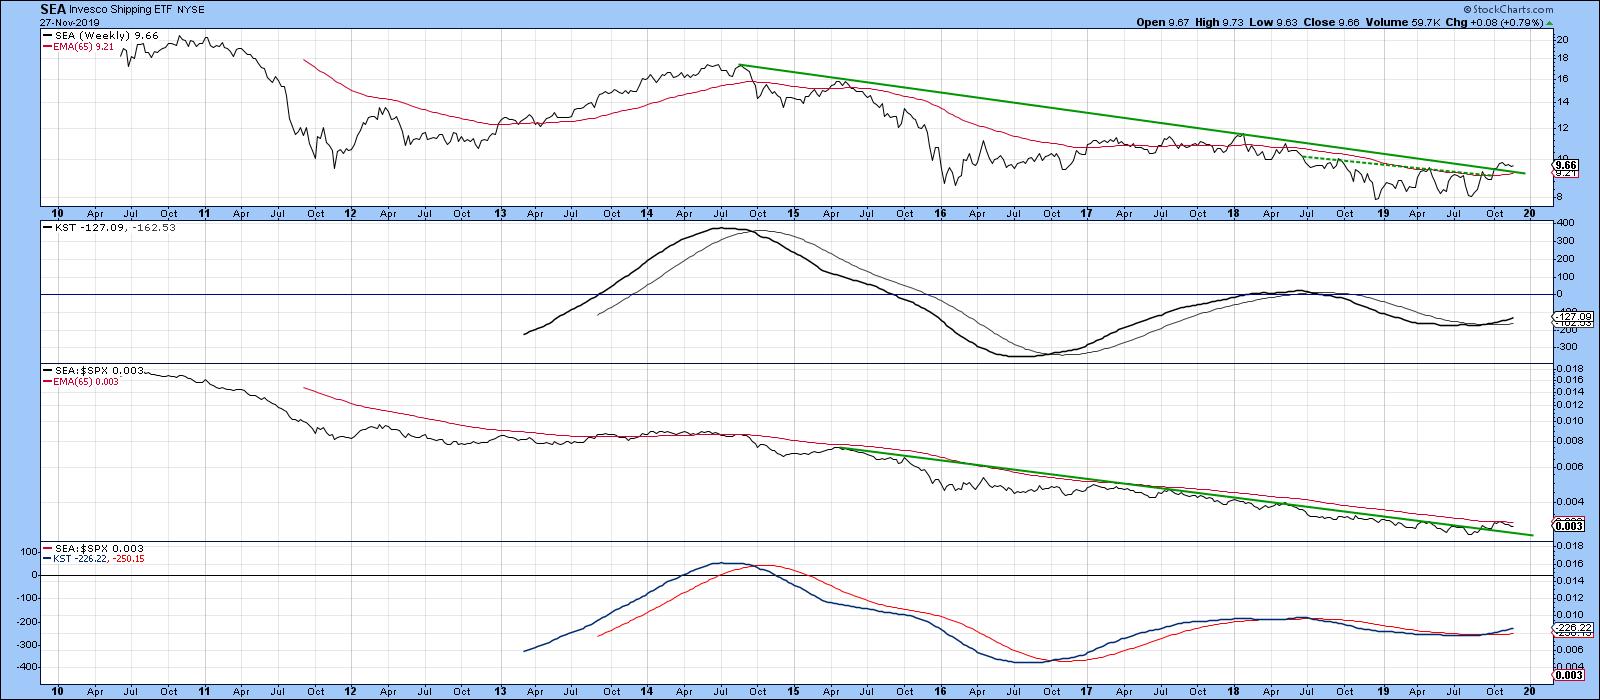
Chart 7
Click here to read the full article in Martin Pring's Market Roundup.
Good luck and good charting,
Martin J. Pring
The views expressed in this article are those of the author and do not necessarily reflect the position or opinion of Pring Turner Capital Group of Walnut Creek or its affiliates.


