 The Russell 2000 ETF (IWM) broke out of a pennant formation last week and then fell sharply this week. This puts price back in the pennant and near its make or break level.
Flags and pennants are short-term continuation patterns that form after a sharp move. Bullish versions represent the pause that refreshes and an upside breakout signals a continuation of the prior advance. Not all breakouts lead to higher prices and some breakouts fail. Today we will look at three pennants in the Russell 2000 ETF (IWM) over the last six months: a failure, a success and a work in progress.
Let's first look at the longer-term picture, the chart below shows IWM trending lower with a falling channel from May to October. The ETF broke out of this channel with a move above the September high in early November. IWM extended on this breakout and hit its initial 52-week high in late November. This small-cap ETF recorded more new highs throughout December and January. The long-term trend is up with the channel breakout and new highs.
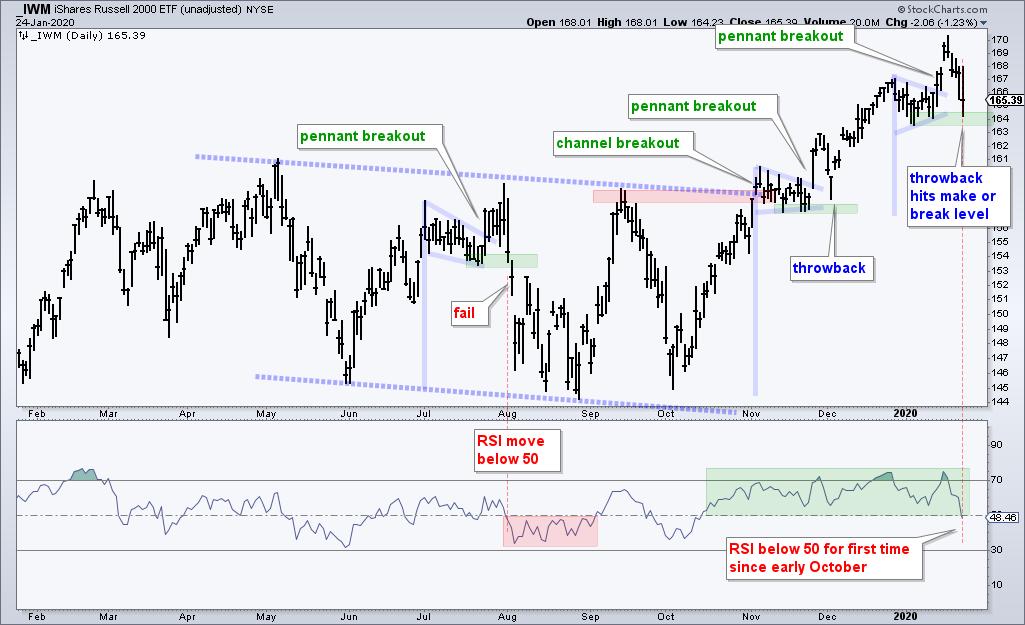
Now let's look at the pennants in July, November and January. The first pennant failed as IWM broke out, failed to hold the breakout and moved below the flag low. Note that this flag formed while IWM was within the falling channel. Thus, the bigger downtrend overruled the pennant breakout. The second pennant formed near the channel breakout. Notice how IWM broke out and then fell back with a sharp three day decline. This is called a throwback and can sometimes offer a second chance to partake in the breakout. The throwback held well above pennant lows and prices then moved substantially higher.
The most recent pennant formed here in January and IWM broke out with a surge on January 14th. This surge did not last long as the ETF fell sharply the last four days and is back near the pennant lows, which offer support. This puts IWM at its make or break level. Either it holds for a successful throwback or fails and breaks down. A breakdown at this stage would be short-term bearish and target a move towards the early November breakout zone (159-160 area). Such a move, however, would not enough to affect the long-term uptrend.
What are the odds of a successful support test here at 164? I would say not very good. First, IWM advanced some 15% from early October to mid January and is entitled to a corrective period. Second, RSI already moved below 50 and the RSI break below 50 in early August led to a deeper pullback.
TrendInvestorPro.com follows IWM and 59 other ETFs on a regular basis. Subscribe today for immediate access to the following: weekly ETF report, ETF ranking tables, market timing models, ETF ChartBook, weekend video, Saturday stock setups and more. Click here to subscribe today!
----------------------
Choose a Strategy, Develop a Plan and Follow a Process
Arthur Hill, CMT
Chief Technical Strategist, TrendInvestorPro.com
Author, Define the Trend and Trade the Trend
Want to stay up to date with Arthur's latest market insights?
– Follow @ArthurHill on Twitter


