Thursday's price action in China resulted in a powerful signal that Chinese equities are headed significantly higher. That should be bullish not only for China but for the world as a whole. In making that statement, I am assuming that that this market is in the process of anticipating an improvement in business activity. Since China is the world's number two economy, that could well help in ending the global slowdown.
Let's start off with Chart 1, which indicates a breakout from an eight-month reverse head and shoulders. Note that the neckline formed at exactly the same level as the opening of the April/May downside gap. It's a great reminder of the importance of such phenomena as potential support and resistance areas. The blue arrows show that the minimum ultimate upside objective from this formation is for prices to reach close to 3,400.
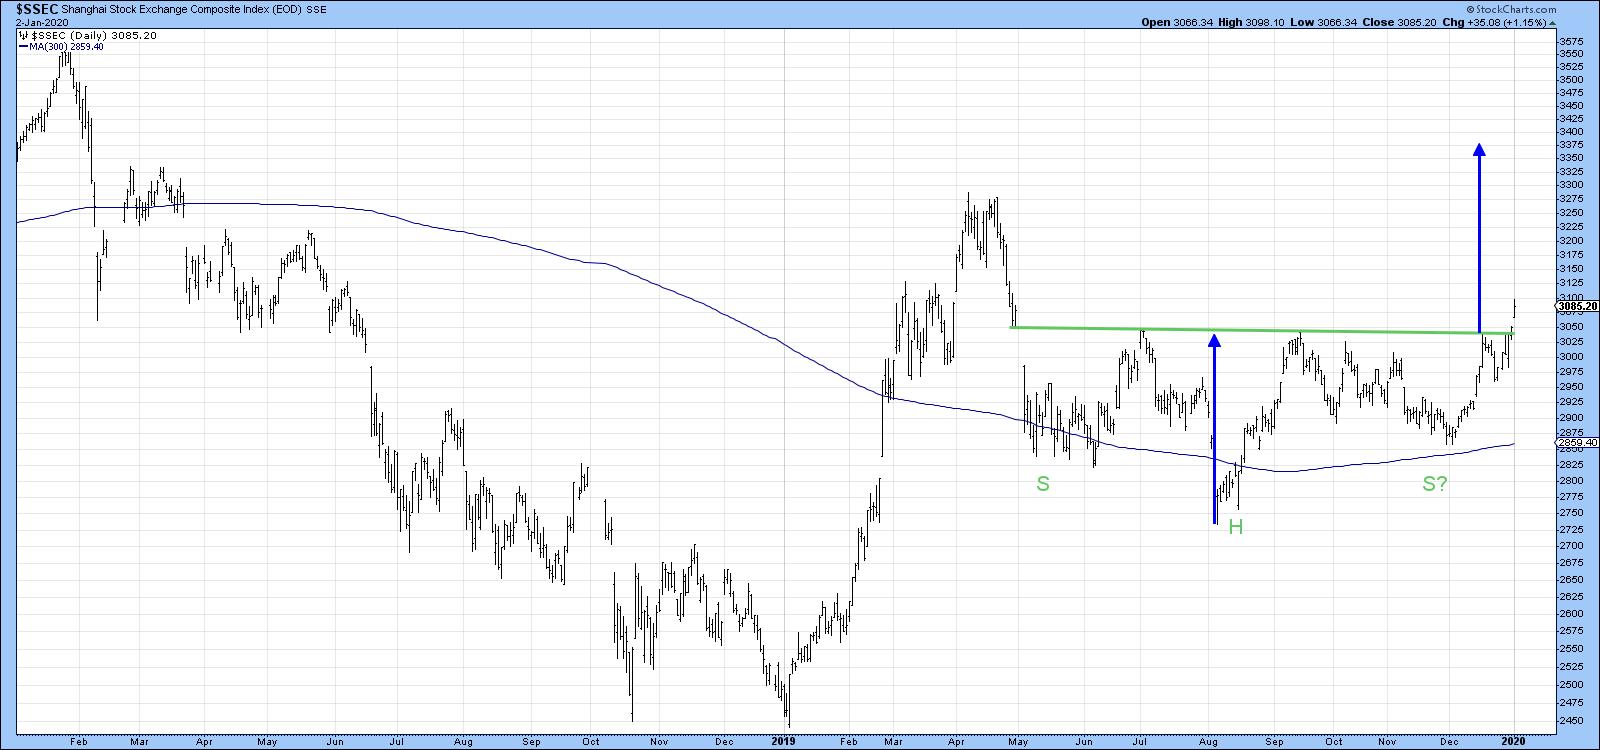
Chart 1
That's a nice move, but Chart 2 tells us that something far more important is happening. Three points are worth noting. First, the Index has broken above its bear market trend line and cleared its 12- and 24-month MAs. Second, it violated its secular uptrend line at the end of 2018 and has now moved back above it, a fact that is confirmed by the breaking of that green 2015-19 downtrend line. Whipsaws of this nature are often followed by above-average moves, as market participants quickly attempt to get back on the right side of the trend. That means we should be prepared for some possible unexpected explosive upside action. Finally, the 18-month ROC has broken above its 2007-19 downtrend line in a similar manner to its 2006 action. I am not predicting that we will see a similar advance to that which culminated in the 2008 peak, but something big is definitely happening here.

Chart 2
Chart 3 shows the same chart but in greater detail, so you can see how close the Index came to a second penetration of the secular uptrend line.
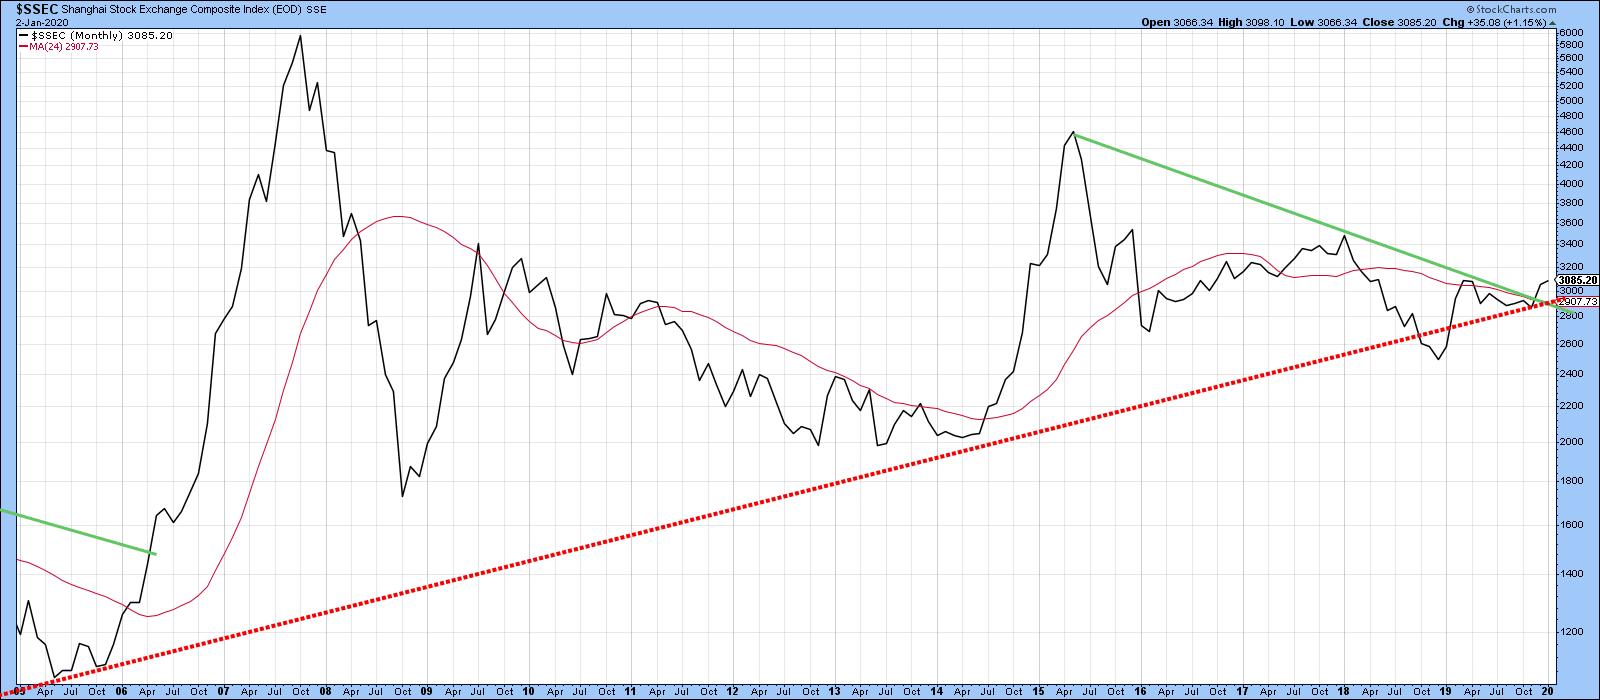
Chart 3
Finally, Chart 4 features a chart from my monthly Chinese newsletter. It monitors a universe of Chinese stocks in a positive trend. Green indicates when it is above its 15-week MA and red when it is below. The arrows show when the indicator bottoms from a low level. That occurred a while ago, but the indicator is now operating on all systems go as it is above its MA once again.
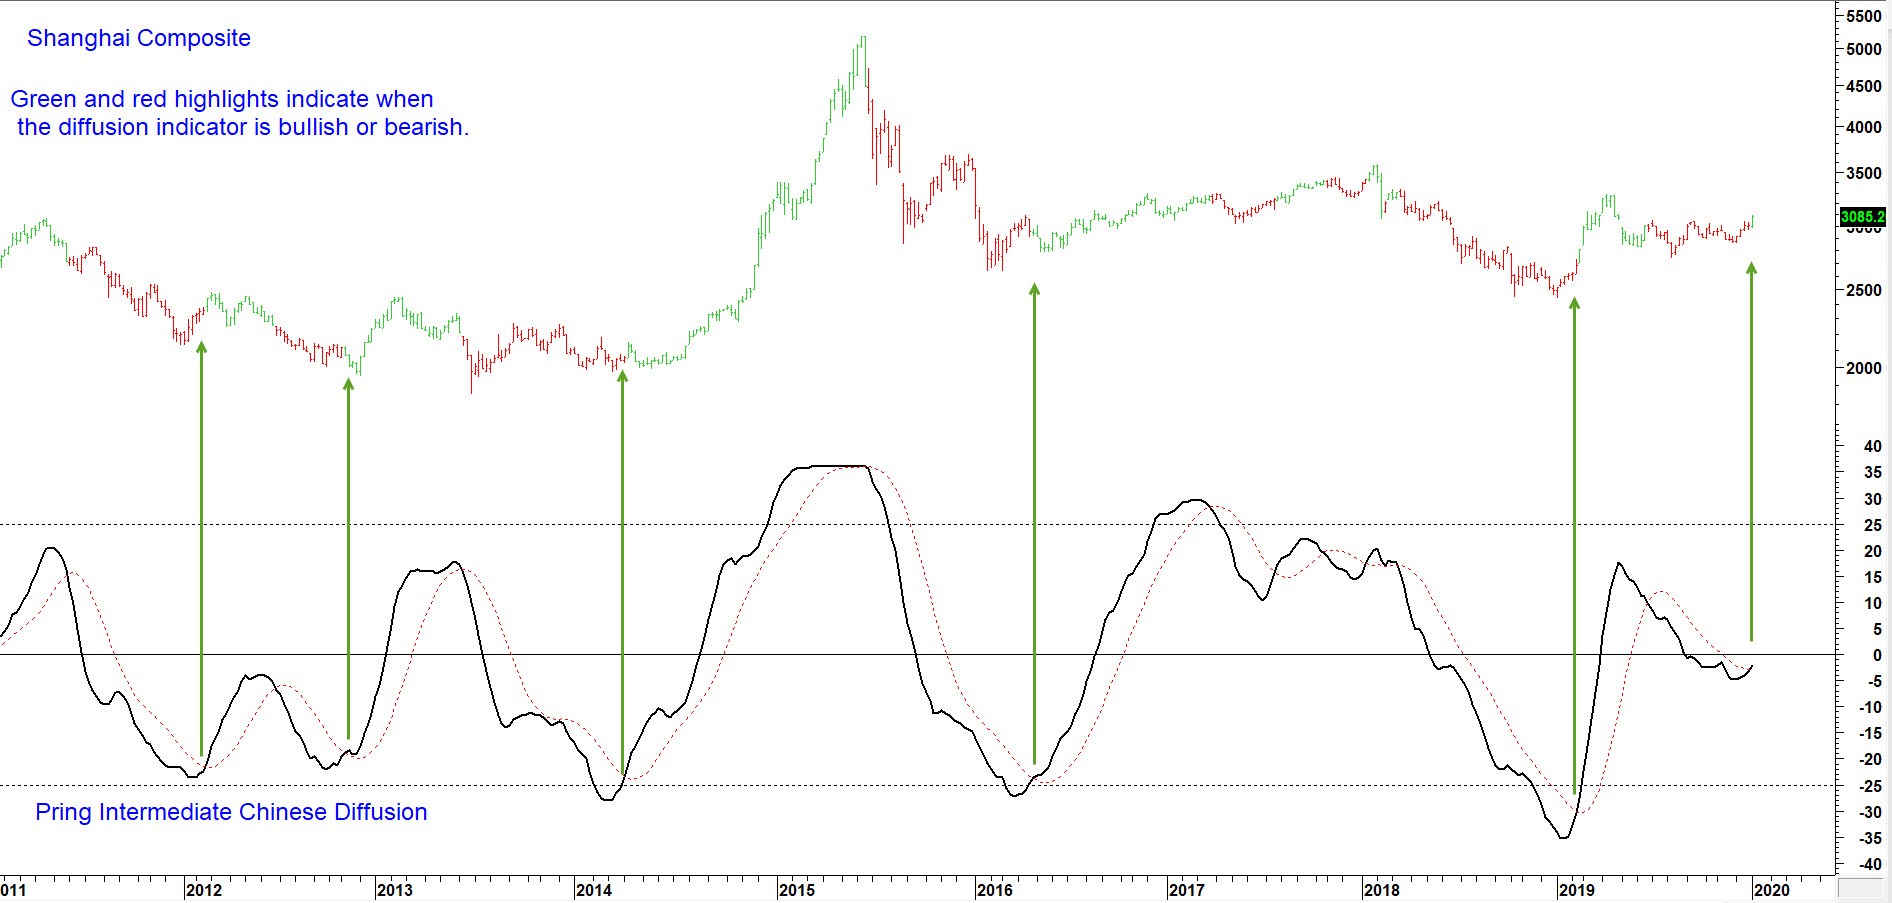
Chart 4
Editor's Note: This is an excerpt of an article that was originally published in Martin Pring's Market Roundup on Thursday, January 2nd at 6:25pm ET. Click here to read the full article, which includes Charts 5-10.
Good luck and good charting,
Martin J. Pring
The views expressed in this article are those of the author and do not necessarily reflect the position or opinion of Pring Turner Capital Group of Walnut Creek or its affiliates.


