Happy New Year and welcome to a brand new decade! A century later, I believe the stock market is about to repeat itself as I'm expecting another roaring 20's! And yes, that could lead to another rough 30's decade, but let's worry about that later. One step at a time here. :-)
Okay, so I took on a big task over the holidays and reviewed every S&P 500 component stock chart from a longer-term perspective (10-year weekly chart). Yep, all 500. Many of the biggest 2019 gains came from stocks that (1) consolidated for a lengthy period before finally breaking out, (2) broke shorter-term downtrends in longer-term uptrends (think "change of character") and (3) pulled back to test a major long-term support level. Timing is key. Let me give you great examples of all three types.
Lengthy Consolidation
Chipotle Mexican Grill (CMG), under fire in 2016 and 2017, took those two years to create the first half of a bullish inverse head-and-shoulders pattern. In 2018, CMG began righting the ship; then, in early 2019, the neckline breakout began a surge that carried CMG to a gain of 93% over the last year. Take a look:
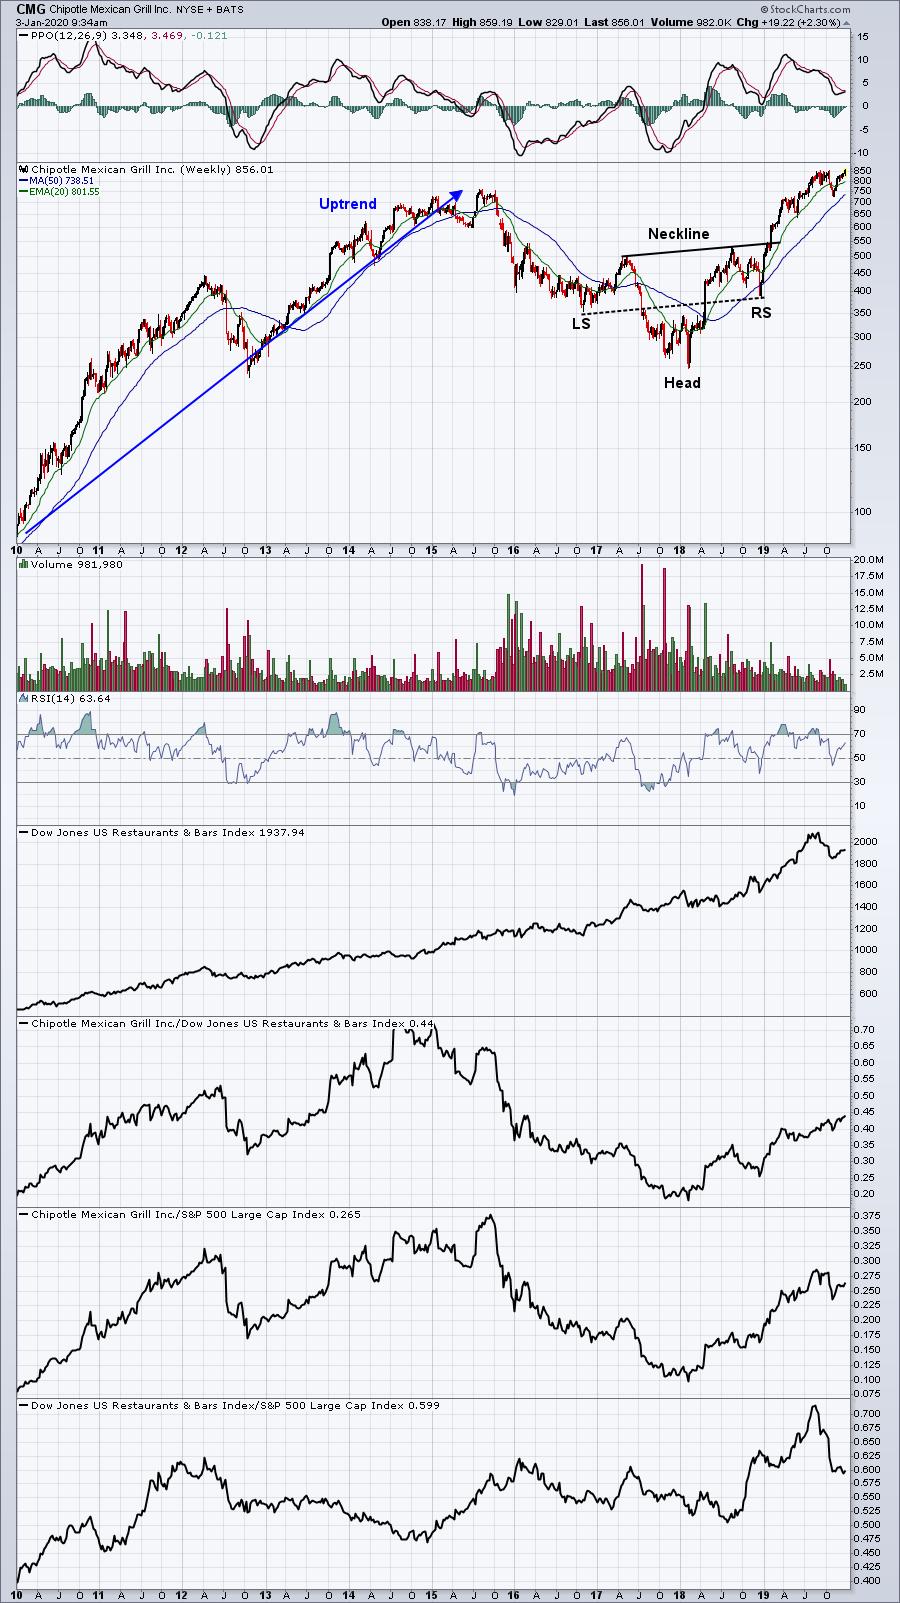
I liked a few things here. CMG began showing relative strength starting in early 2018, where its neckline was up-sloping, as were its left and right shoulders. That's much more bullish than the alternative. CMG has been a staple in our Model Portfolio at EarningsBeats.com since February 2019; the above chart was a big reason why.
Long-Term Uptrend, Short-Term Downtrend Breaks
Lam Research (LRCX) saw a "character change" on its weekly chart, one which came almost squarely on a very important Fibonacci retracement level (61.8%) as it broke out of a very bullish wedge formation:
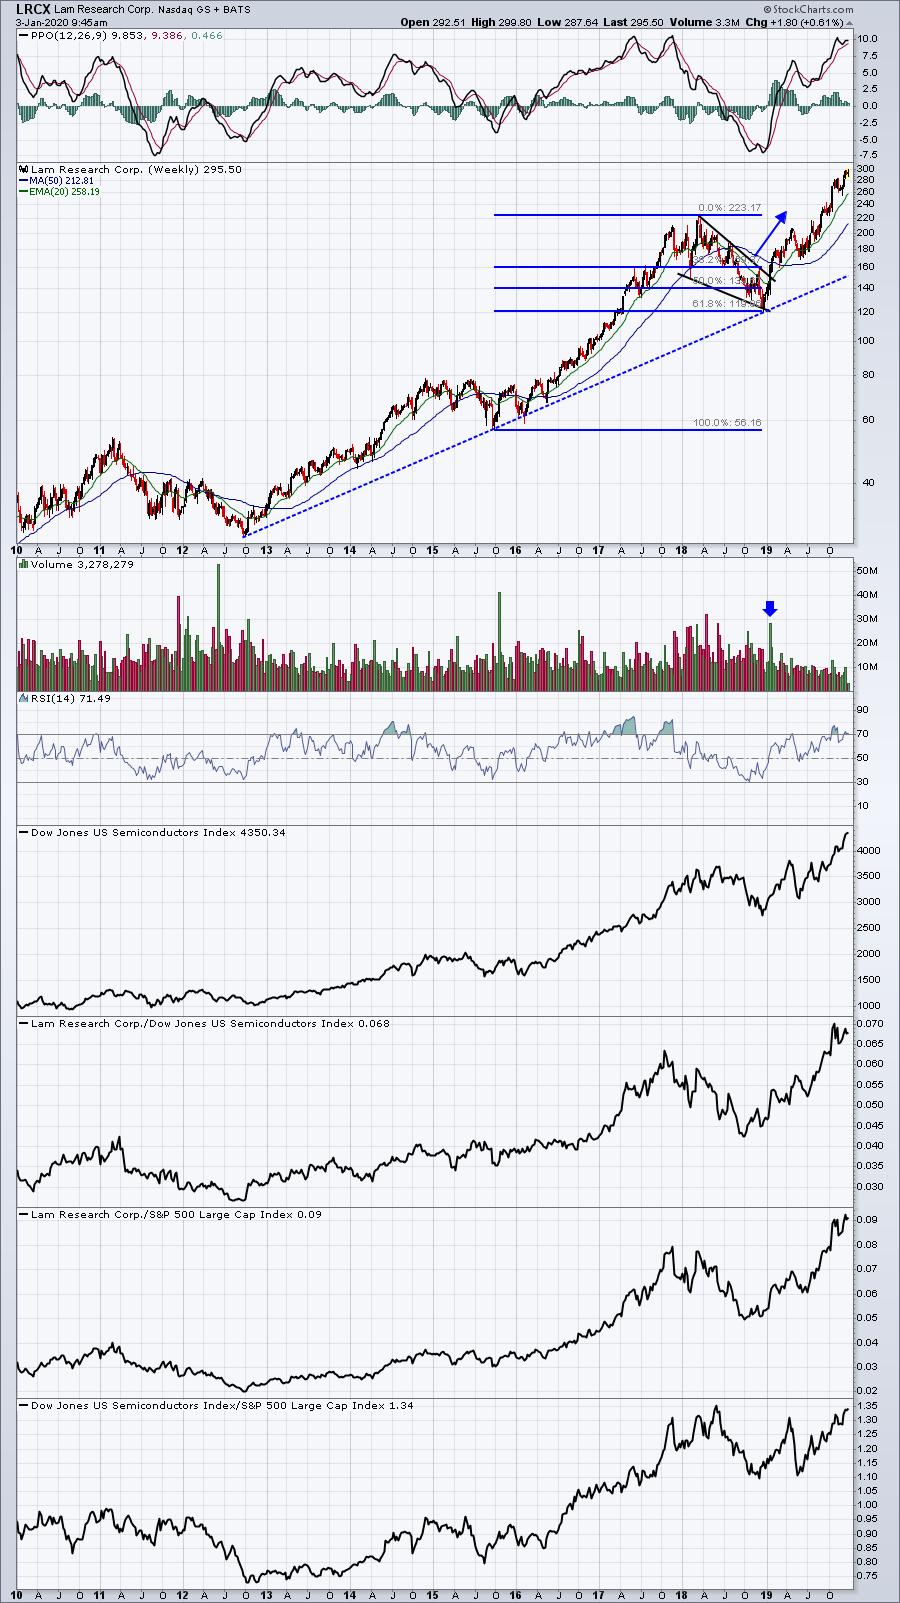
LRCX is a great company, but the masses gave up on it because of its very rough 2018 campaign. That was a BIG mistake. Once the Fibonacci retracement was completed and the bullish wedge gave way to the upside, LRCX was flying higher! You can catch stocks like LRCX, but you need to recognize these longer-term basing/consolidation patterns and await the breakout.
Pullback To Test Major Long-Term Support Level
Advanced Micro Devices (AMD) was the best performing S&P 500 stock over the past year. It gained a very impressive 160%, bouncing beautifully off of key long-term price support:
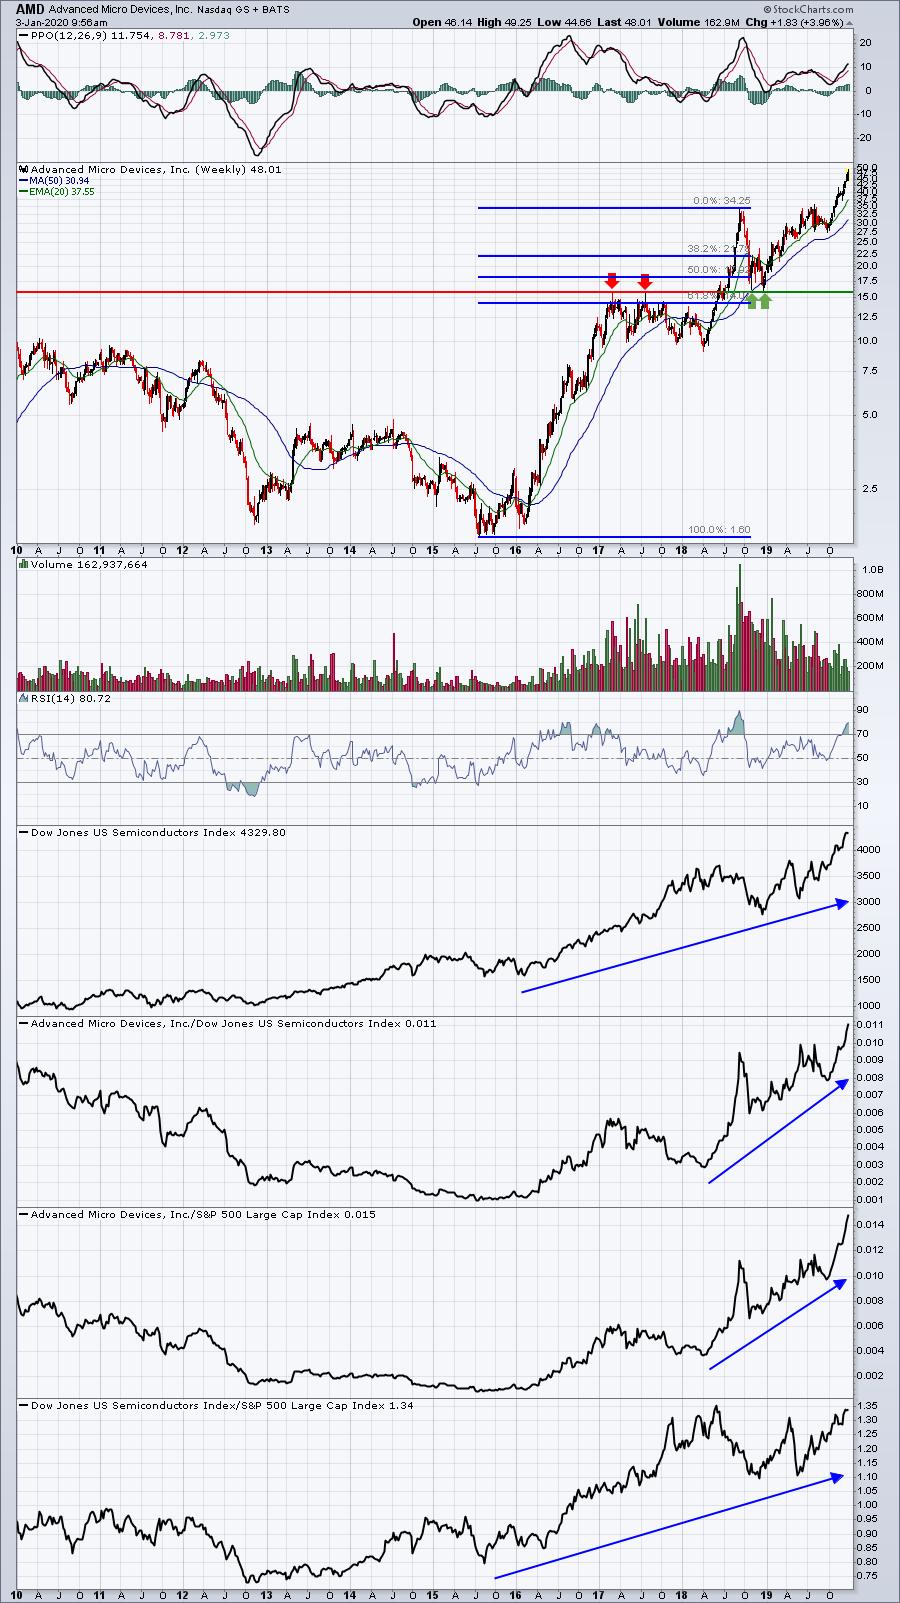
Like LRCX, AMD saw a significant selloff until it hit a level between the Fibonacci 50% and 61.8% retracement levels. Also, note the double top from 2017 near the 16.00 price level. The massive December 2018 selling took us right down to the support level created by the 2018 Q2 breakout above 16.00. Spotting that support test would have yielded incredible 2019 results.
Okay, so those are three investments that, with great hindsight, would have enabled your portfolio to soar. So now we'll take on the much tougher challenge, which is... what stocks will be the 2020 leaders? Which ones will I be writing about in January 2021?
Again, I reviewed all 500 component stocks of the S&P 500, looking for exactly the type of patterns and consolidation shown above. Yes, the S&P 500 was at a record all-time high at December 31st, but not all S&P 500 stocks enjoyed the party. They may be planning their very own 2020 party. I'll unveil my favorite 15 S&P 500 charts at Market Vision 2020, which is slated for tomorrow, Saturday, January 4th. I'll be speaking with several of your favorite StockCharts.com bloggers and TV show hosts, including none other than John Murphy, who is the Keynote Speaker. There's still time to join us if you hurry and, even if you can't make the event LIVE, there'll be a full recording for all those who register. CLICK HERE to register NOW!
But I wouldn't leave you hanging like that. I want to share THE stock that I believe is setting up for 2020 very, very similarly to how LRCX set up for 2019. It's gained 18% over the past year, but it's down significantly from its intra-year high. I believe it's consolidating in a bullish wedge just as LRCX did. Check this out:
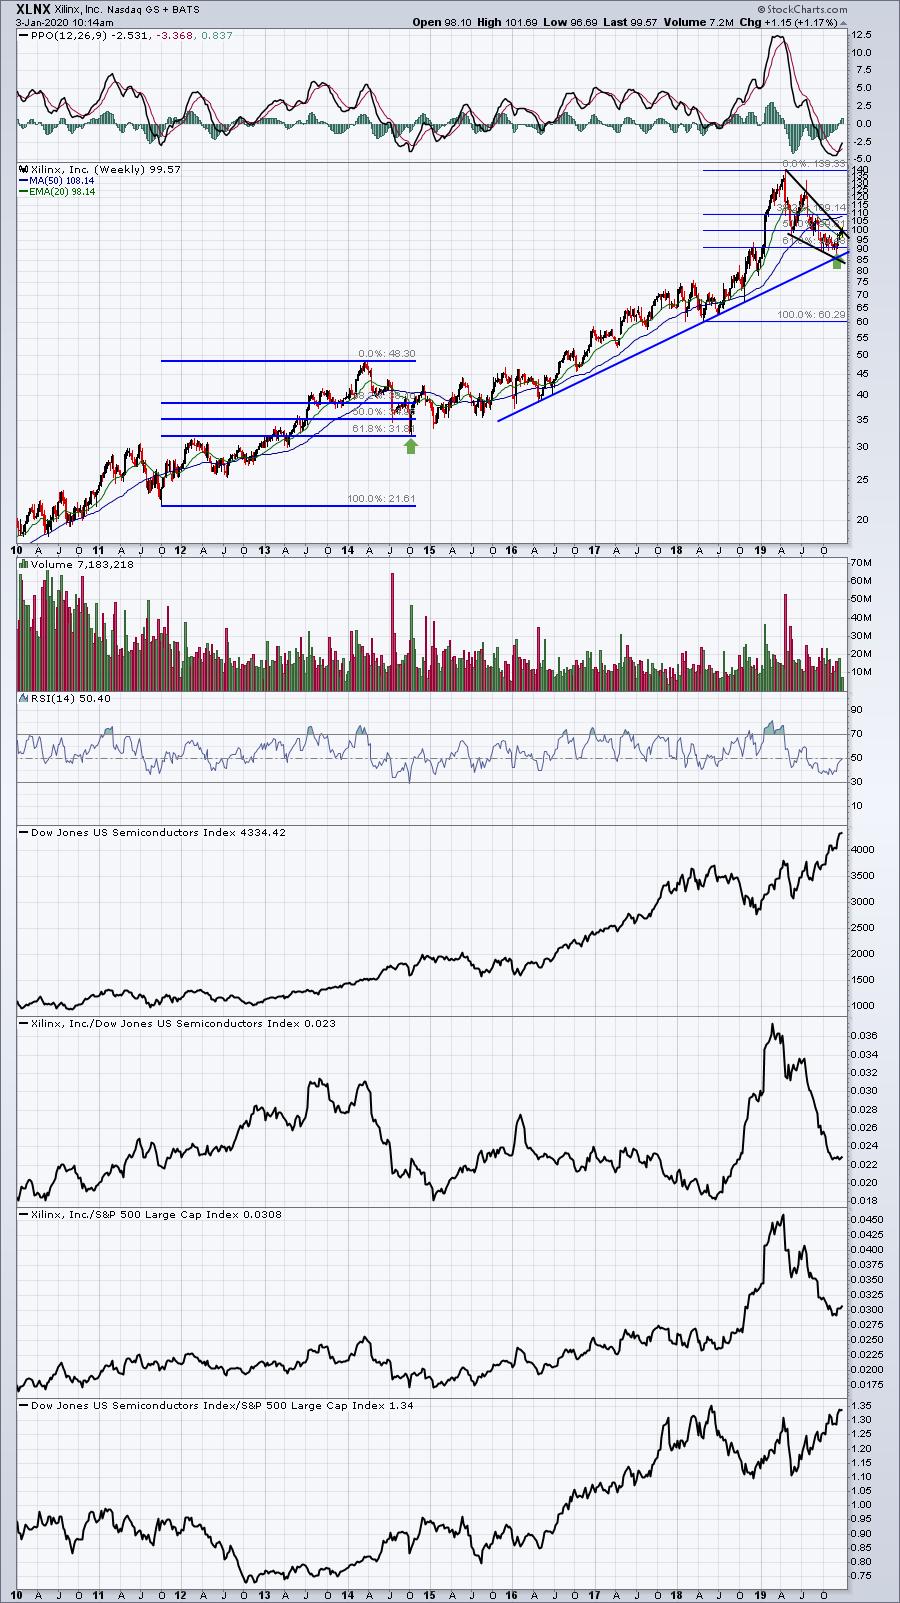
It's been a bad, bad 9 months since April 2018. We need to keep the long-term chart in perspective, however. XLNX has fallen nearly 30% since that April high, all while the S&P 500 is breaking out to all-time highs. Clearly, that's not good, but I see a bull wedge with 61.8% Fibonacci support recently tested. Yes, XLNX has been an extreme underperformer! Nonetheless, I have these words of wisdom:
Don't overlook XLNX in 2020. Its earnings report in a few weeks could be the trigger, so watch it closely.
If you're interested in the other 14 Top S&P 500 Stocks For 2020, I will present the long-term weekly charts of all 14 tomorrow during my Market Vision 2020 presentation that will run from 5:00pm EST to 6:00pm EST. Remember, this event will be recorded and available to all that register. I really hope you can join me, John Murphy, Arthur Hill, David Keller and so many other StockCharts.com friends and colleagues in what I believe will be the absolute best online financial conference of 2020. FOLLOW THIS LINK to register for Market Vision 2020!
Happy trading!
Tom


