While sectors like Technology of received much of the praise for leading the recent market upswing, the Health Care sector is comprised of a group of five industries that all have fairly attractive chart setups. (Earlier this week, on my daily closing bell show The Final Bar, I conducted a deep dive on the Health Care sector to demonstrate the strength in the industry charts and to highlight the potential upside for this emerging sector.)
The Health Care sector ETF (XLV) established a resistance level in late 2018 around the $93 level. This price ceiling held in December 2018 and again in summer 2019. In November of last year, the XLV finally broke above this key price level before continuing on to higher highs through the beginning of 2020.
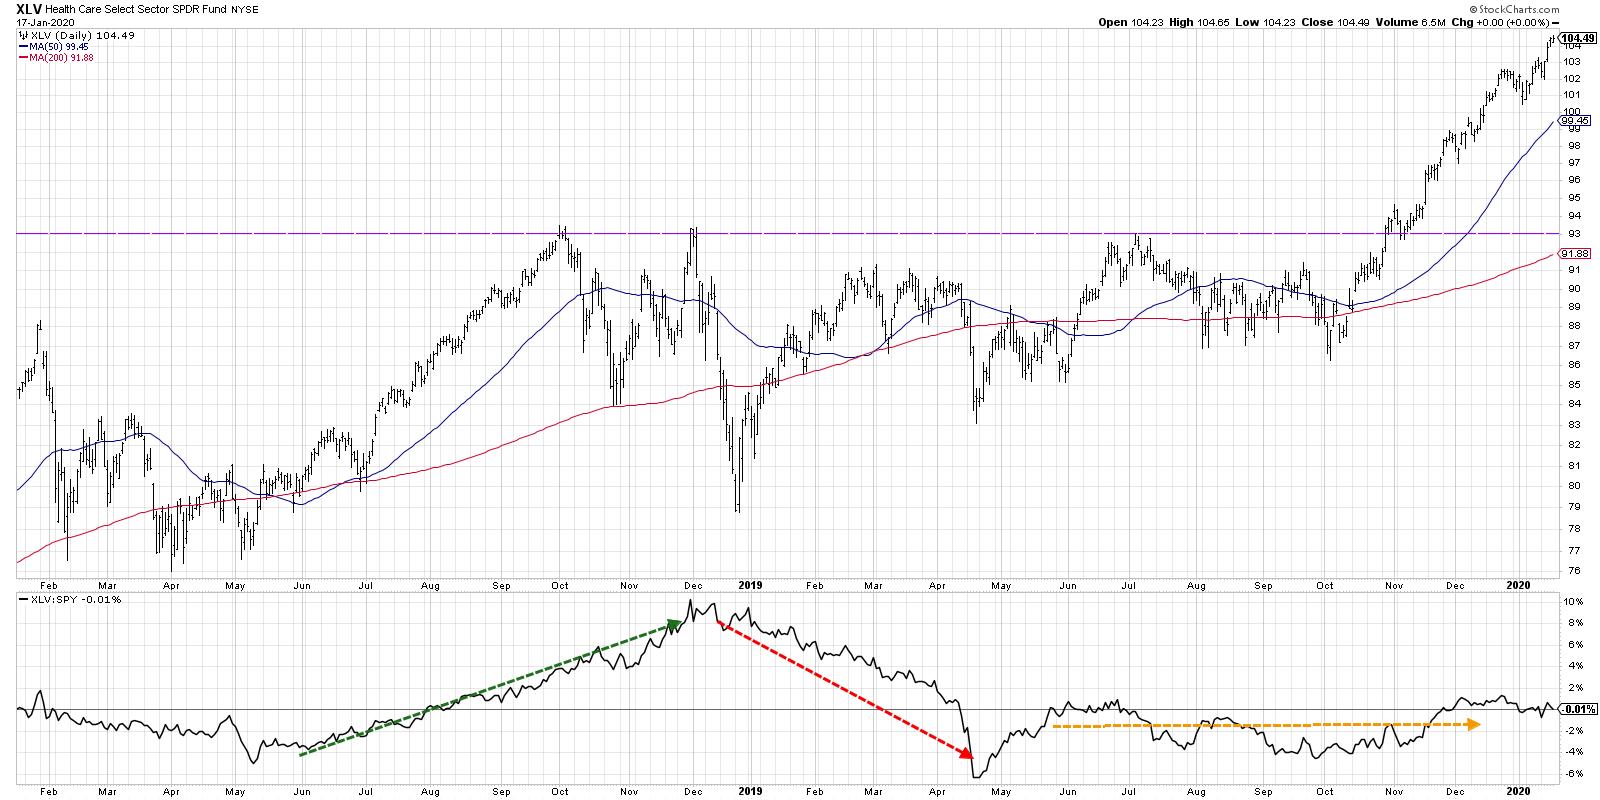
The relative strength line shows the strength in Health Care during the second half of 2018, as the XLV outperformed the S&P 500 through the market bottom in December 2018. The first four months of 2019 saw the XLV underperform as other sectors rebounded much better from the 2018 market low.
The remainder of 2019 saw Health Care as a market performer with a flat relative strength line. As of mid-January 2020, the XLV has as 0% relative return vs. the broader equity markets for the last two years. Looking deeper at the industries that comprise the Health Care sector highlights the dispersion of returns within the sector - and also shows some potential opportunities.
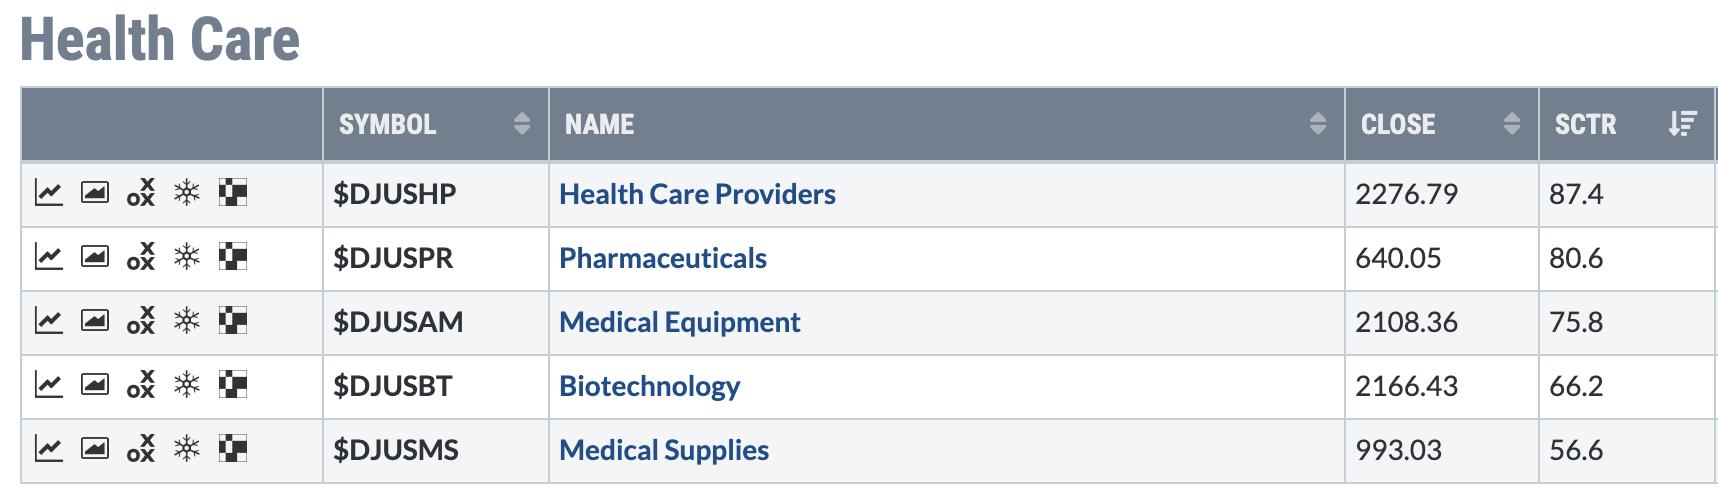
There are five industries within the sector, including Biotechnology, Health Care Providers, Medical Equipment, Medical Supplies and Pharmaceuticals. Let's look at each of these industries in descending order of their Industry SCTR ranking:
1) Health Care Providers
This industry includes HMOs and other health care provider firms, such as UNH, HCA, CI, ANTM and HUM.
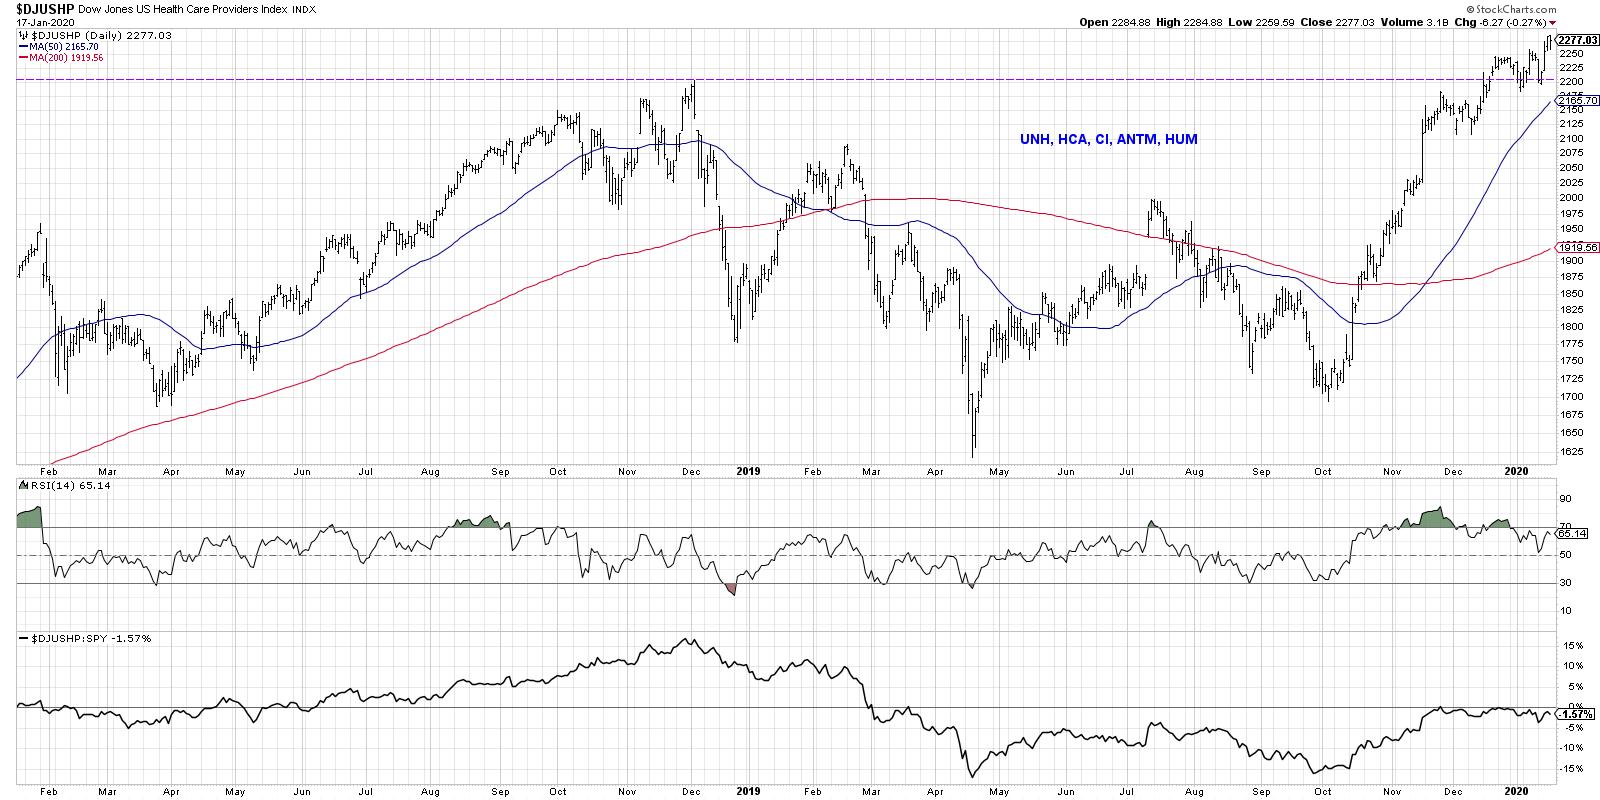
The industry has finally returned to significant price resistance from December 2018 and has once again pushed to new highs. If there's any concern here, it's the potential bearish divergence, with higher highs in price and lower peaks in RSI. Overall, the trend remains positive.
2) Pharmaceuticals
The big pharma names included here are JNJ, MRK, PFE and CVS.
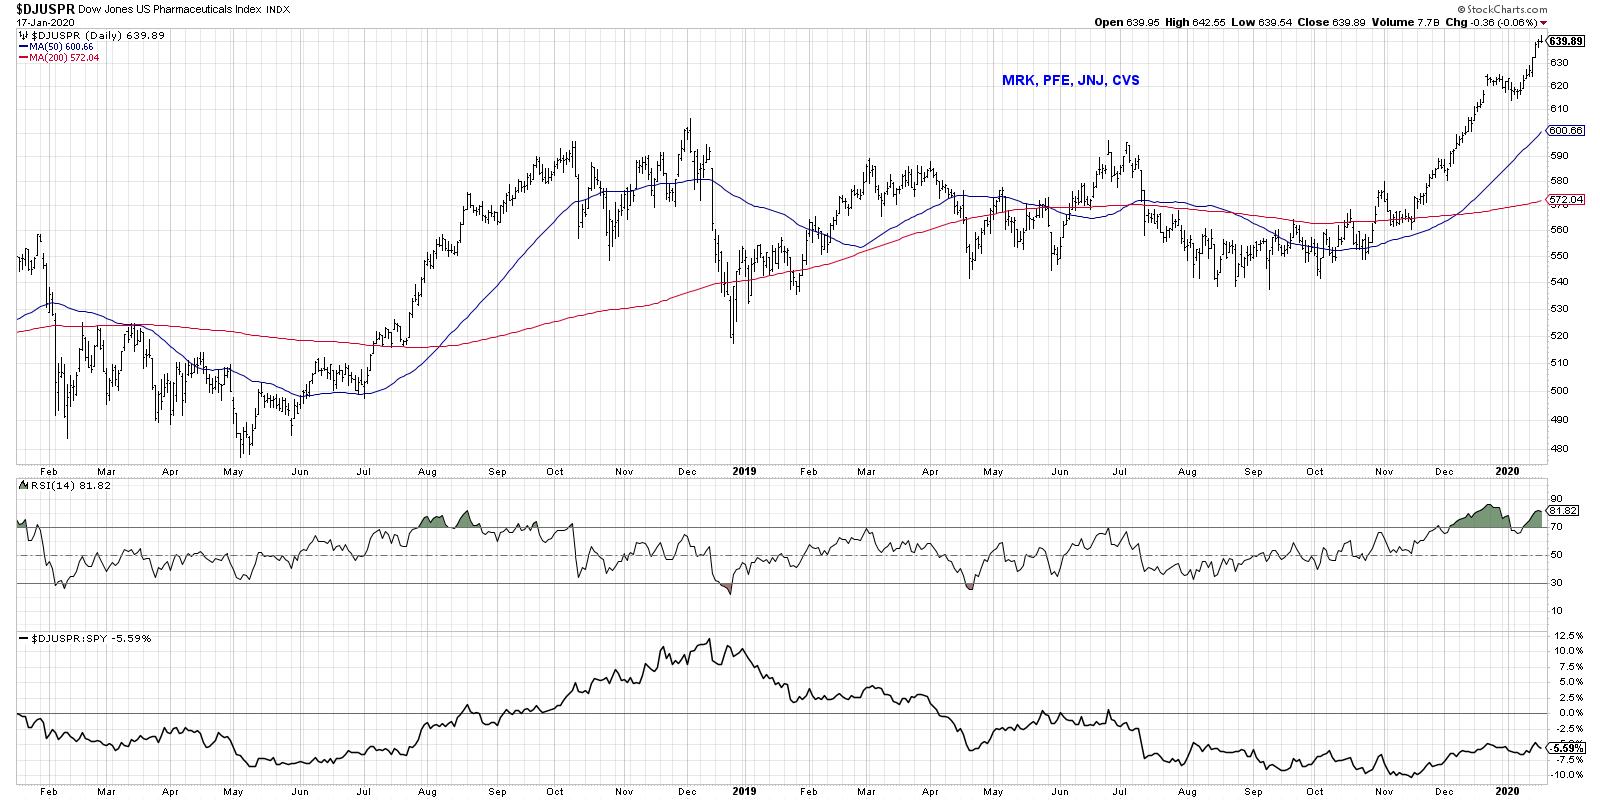
Here we see a bit of a flatter base than the Health Care Providers group, but a similar pattern, with a successful retest of resistance before a break higher. This group is extremely overbought, with an RSI above 80. This usually suggests further upside after a brief pullback due to the very positive momentum.
3) Biotechnology
The biotech sector consists of stocks like BIIB, GILD, AMGN and ABBV.
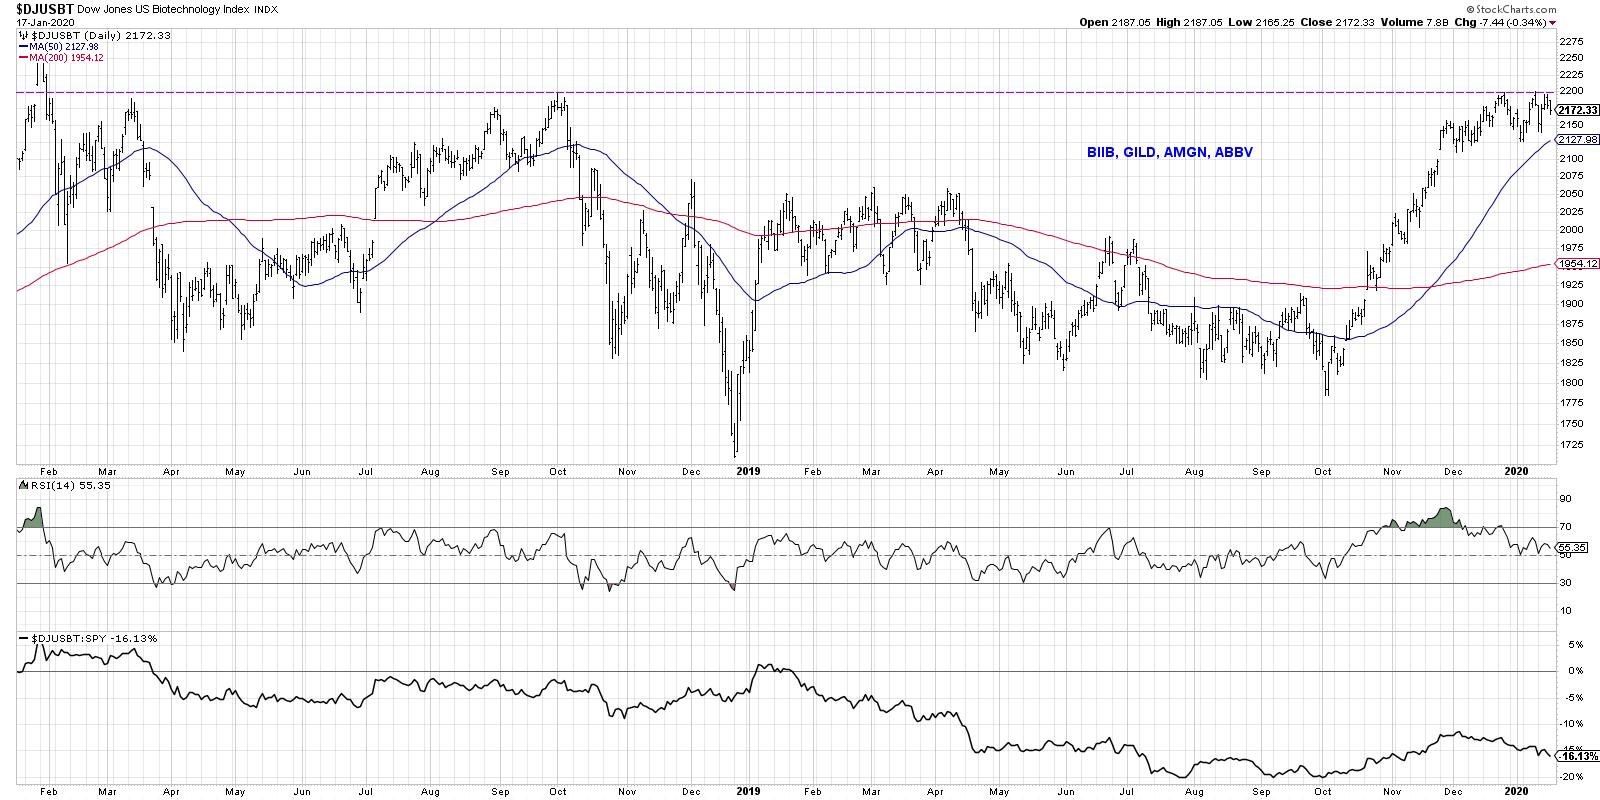
I would argue this is the most important chart in the space, as it is a key group up against a significant resistance level. Either the biotech industry breaks above the 2200 level and continues in a position of strength, or it fails at resistance and settles back into the previous range. Either way, I would not be surprised if the broader market follows the general direction of this group.
4) Medical Equipment
This group includes stocks like BSX, STE, MDT, WAT and A.
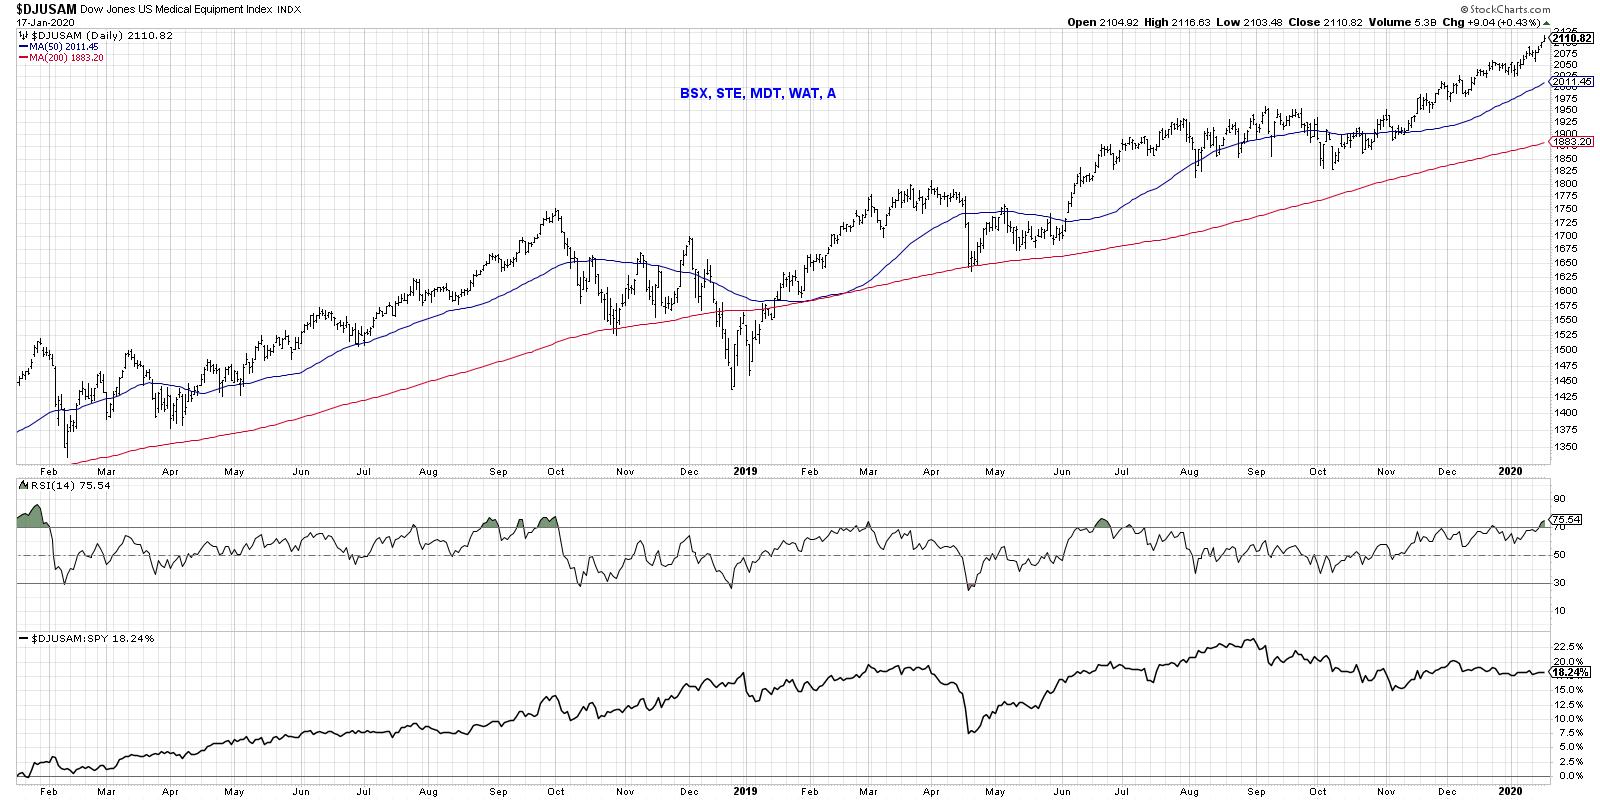
Now we finally see a group with a very different return profile than the other groups we've reviewed thus far. If you covered up the tickers, you might expect this to be an industry within Technology! While the relative strength has not been incredibly impressive, the price trend has been consistently positive, keeping pace with the broader equity markets.
5) Medical Supplies
This industry is comprised of names like BAX, EW, BDX and CAH.
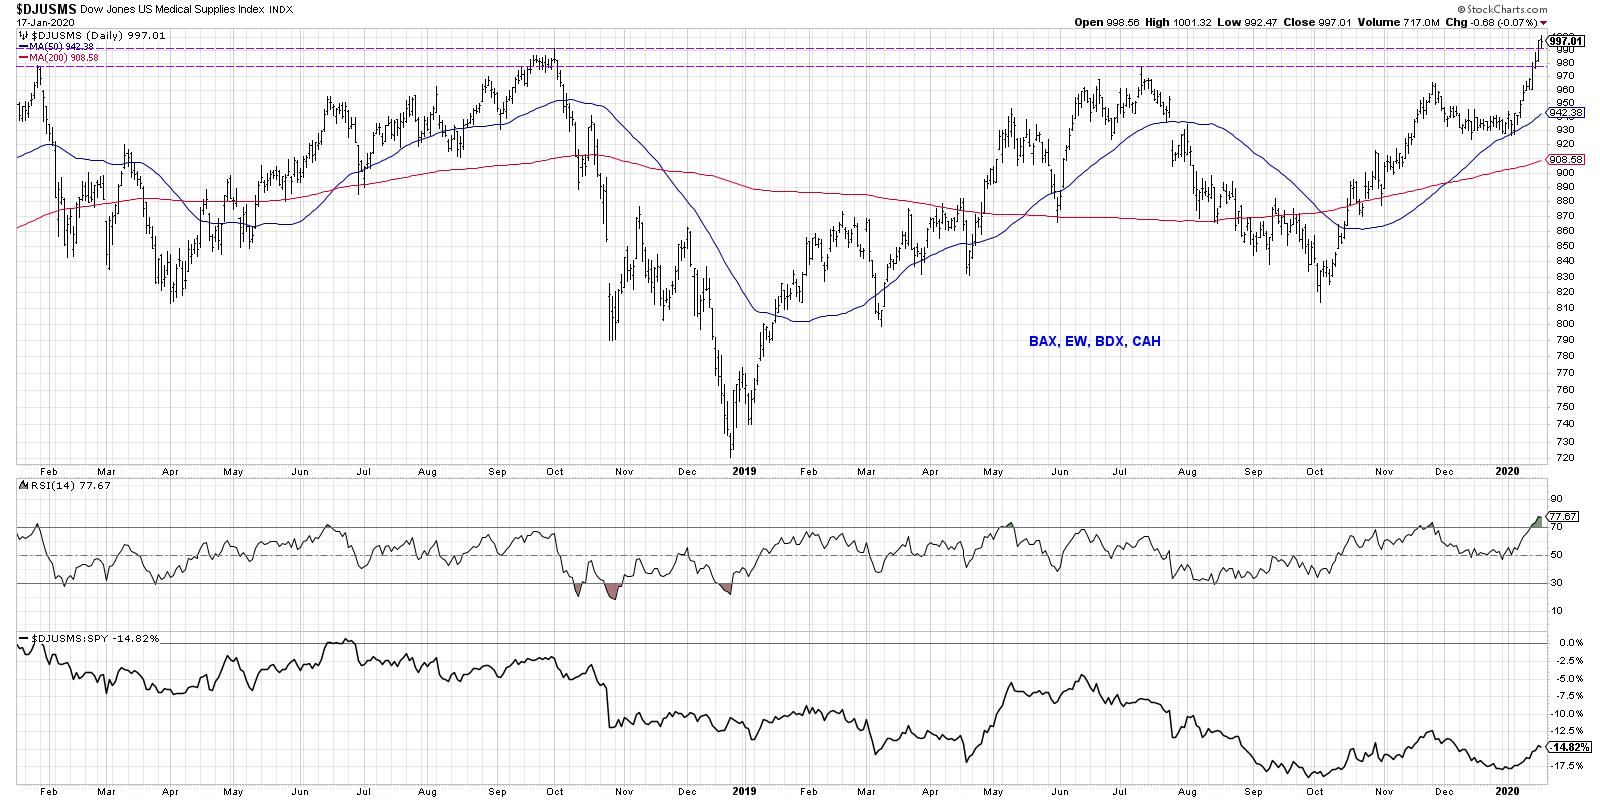
Medical Supplies are potentially the most actionable idea out of these five charts. The last two years look like a "cup-with-handle-with-handle" pattern, with a broad rounding bottom followed by a series of more shallow pullbacks. In the last couple weeks, this industry has broken to a new high, eclipsing a huge resistance level going back to September 2018. The RSI is almost extremely overbought, which would suggest further upside after a brief pullback.
With the strong uptrend in the Health Care sector chart, it's well worth considering the movements of the five industries that comprise the sector. By following these charts in the coming weeks and months, investors should have a better sense of the strength of this sector, as well as implications for the equity markets as a whole.
RR#6,
Dave
David Keller, CMT
Chief Market Strategist
StockCharts.com
David Keller, CMT is Chief Market Strategist at StockCharts.com, where he helps investors minimize behavioral biases through technical analysis. He is also President and Chief Strategist at Sierra Alpha Research LLC, a boutique investment research firm focused on managing risk through market awareness. He is a Past President of the Chartered Market Technician (CMT) Association and most recently served as a Subject Matter Expert for Behavioral Finance. David was formerly a Managing Director of Research at Fidelity Investments in Boston as well as a technical analysis specialist for Bloomberg in New York. You can follow his thinking at MarketMisbehavior.com, where he explores the relationship between behavioral psychology and the financial markets.
Disclaimer: This blog is for educational purposes only and should not be construed as financial advice. The ideas and strategies should never be used without first assessing your own personal and financial situation or without consulting a financial professional.
The author does not have a position in mentioned securities at the time of publication. Any opinions expressed herein are solely those of the author and do not in any way represent the views or opinions of any other person or entity.


