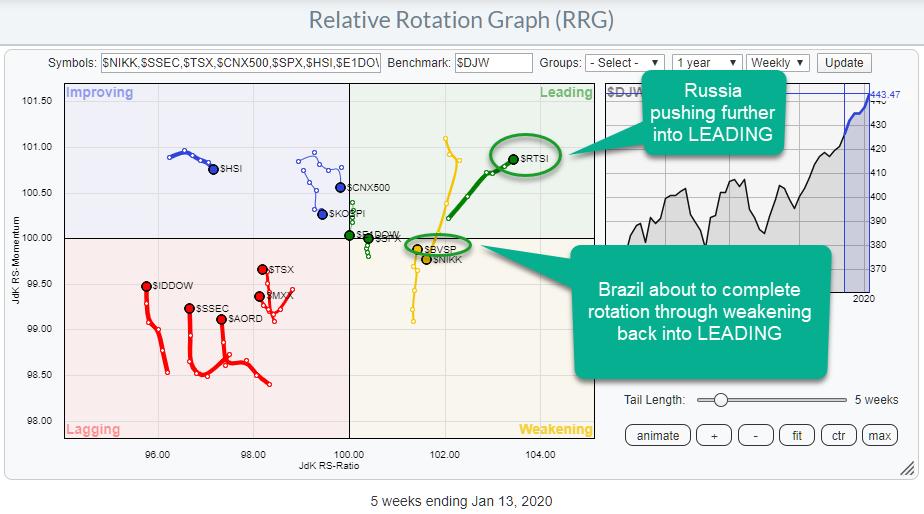
 Weekly RRG showing international stock market rotation
In my last article for the RRG blog, I wrote about the process of how to get from an idea, whether based on RRG analysis or something else, to a position in your portfolio. That post was geared towards the observation that Growth stocks are outperforming Value stocks and focused on how to get such a view into a real position in a portfolio. Another area where "tradable instruments" are needed to get exposure to a certain part of the market are international stocks.
For a lot of people, it is not that straightforward to trade international stocks. Sometimes (US) brokers often do not offer the service, sometimes it may be restricted by a government, sometimes it may require a different type of account, etc. It's often a hassle. But the good news is that, for a lot of the major foreign markets, ETFs are now available, which brings diversification into markets outside the US within reach for many more (retail) investors and traders.
An RRG with the rotation for some major international stock markets is available under the predefined dropdown groups on the RRG page. That RRG is printed at the top of this article.
As you may notice, the securities on the RRG are INDEXES, NOT ETFs!!! The reason for using indexes on the ETF for analysis is that they show the true performance for these markets. The tradable ETFs that US investors can use to create exposure to these markets are (very often) quoted in US dollars, which brings another variable to the game: the relationship between the currency of a particular (stock) market and the US dollar.
For a pure and unbiased analyses of international markets, I prefer to use the indexes instead of the ETFs. Once it comes to the implementation of a view into a portfolio, the ETFs come into play.
Looking at the RRG for these international markets, two tails attract my attention. The first one is $RTSI, the Russian market, and the second one is for $BVSP, the Brazilian market.
$RTSI - Russian Trading System (RTS) Index
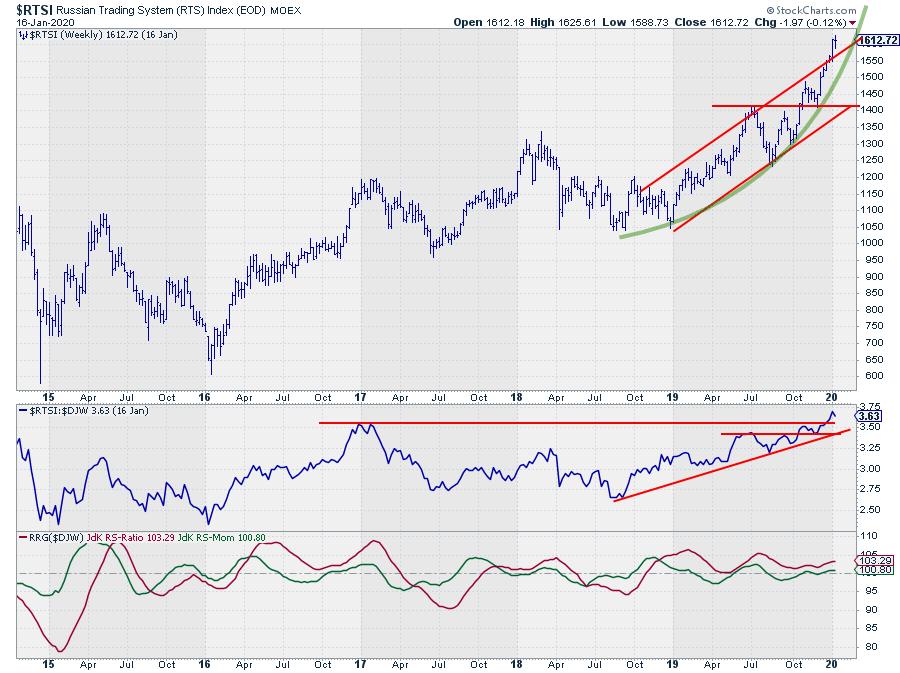
Over the last two months, $RTSI started to accelerate its rising trend and even managed to break above the upper boundary of the rising channel. Breaking an already rising resistance line is a strong sign, at least IMHO. The acceleration of the rally is annotated using the curved green line. This improvement of the rally has caused the relative strength of $RTSI vs. the DJ Global index to improve further and take out the relative high of January 2017.
$RTSI moved into the leading quadrant back in October 2018 and has completed two rotations from leading through weakening into leading. The last one in October 2019. That move is now still underway and the break to new relative highs, in combination with the break above rising resistance in price, makes Russian stocks attractive at the moment.
To get involved and get a position in Russian stocks, there are a few ETFs available. One of these is RSX, the VanEck Vectors Russia ETF traded on NYSE.
RSX - VanEck Vectors Russia ETF
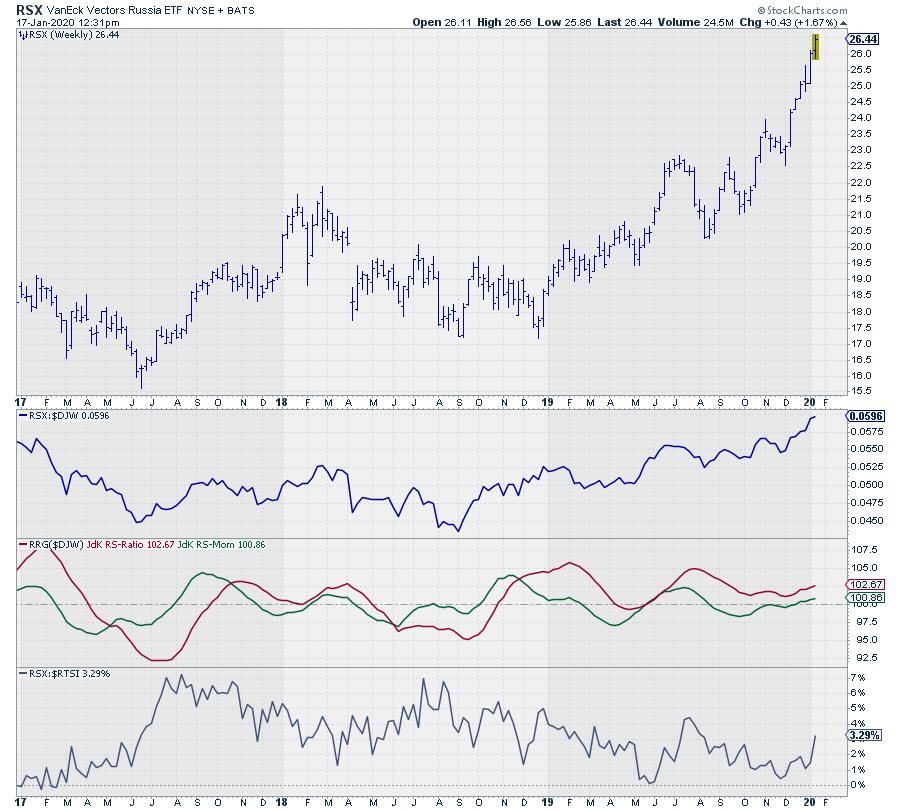
This chart shows the development of RSX in price and vs $DJW for the relative strength and the RRG-Lines. As you can see the moves are largely the same, as one would expect...
The graph in the bottom pane shows the relationship, in performance, between RSX and $RTSI. The chart is zoomed in from the $RTSI chart to show the last three years; you can see that the difference in performance between these two roughly moves between 0% and 7%.
This difference is due both to the fact that RSX tracks a slightly different index than $RTSI (though the two are highly correlated) and, more importantly, to the currency exchange rate between the Russian Ruble and the US dollar. This is something that you need to be aware of as an investor when you use these ETFs covering foreign markets.
$BVSP - Brazilian Bovespa Stock Index
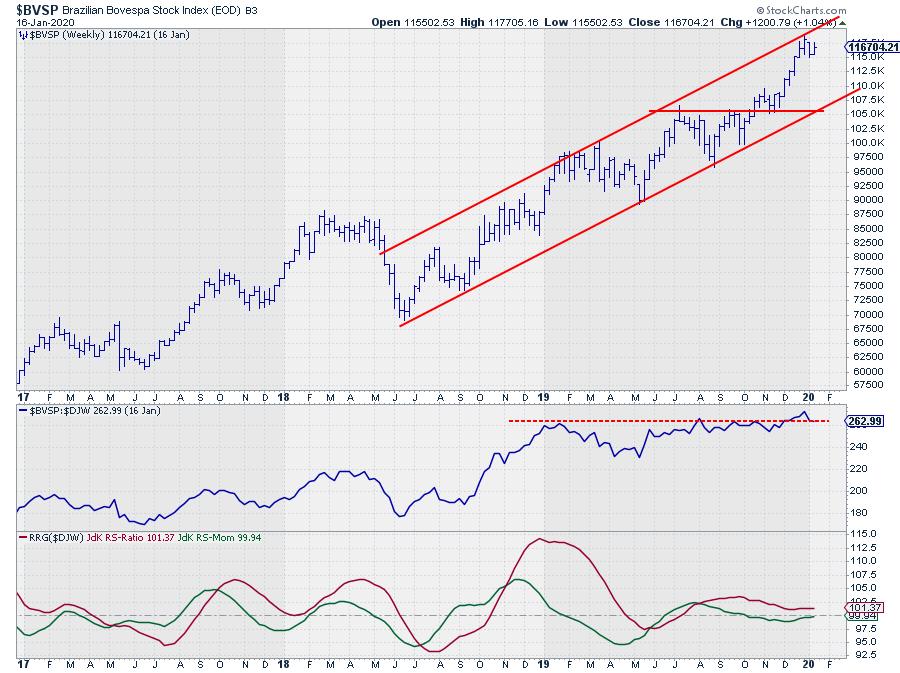
The Brazilian market is a slightly different story.
$BVSP has been moving inside a rising channel since mid-2018. From a relative point of view, the second half of 2018 was very strong but, during the course of 2019, relative strength flattened and started to move sideways. Against the DJ Global index, $BVSP managed to hold up, with the JdK RS-Ratio remaining above 100, but the dip of JdK RS-Momentum below 100 caused a short rotation through weakening.
With both RRG-Lines very close to 100, things become a bit unclear; I would like to see a bit more confirmation either from a relative or a price perspective before making any decisions on the long side.
The relative strength line is attempting to break above the early 2019 relative high. When that convincingly happens, things will likely improve further for Brazil. On the price chart, $BVSP is pushing against the rising resistance line, while there is quite a bit of room for a decline within the channel without breaking the trend. If $BVSP manages to break this upper boundary like $RTSI did, then things will turn for the better immediately. If not, we may need to wait for a correction within the channel and look for buying opportunities at lower levels.
As for the instruments needed to create exposure to the Brazilian market in a portfolio, there are again a few ETFs, the most popular one probably being EWZ.
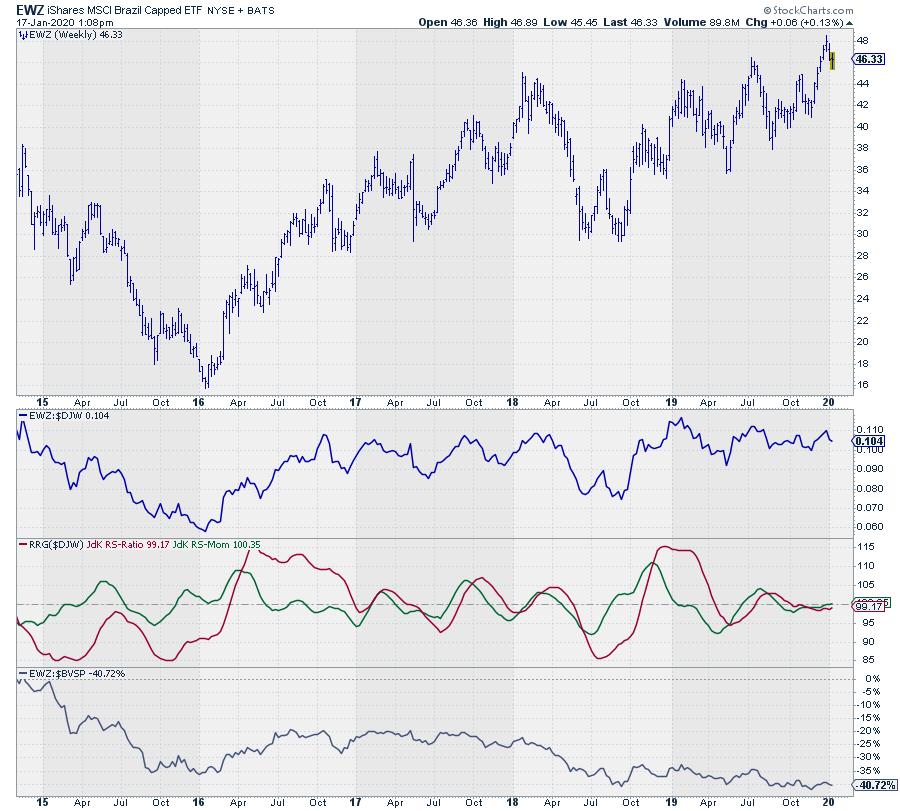
Wow!!!!! ;)
As you can see, the price pattern for EWZ is significantly different from $BVSP. Again, one of the reasons is the fact that this ETF tracks the MSCI Brazil index, but the real kicker in this case is the BRL/USD exchange rate.
The lower pane again shows the difference between EWZ and $BVSP. Over the past few years, depending on where you start, these have been some serious double digit declines. To be clear, the US dollar gained significantly against the Brazilian Real.
Thus, an investment in EWZ made, let's say, at the bottom in 2018 would have returned $46:$30=1.53, or 53%. The underlying market $BVSP over the same time moved from 70k to 117k, which equals roughly 67%. That's a serious difference and something to take into account as a USD-based investor.
Concluding
Both tails for $RTSI and $BVSP show promising rotations, but, with $BVSP just below overhead resistance and a shaky FX relationship, $RTSI via RSX seems to be more promising.
--Julius
My regular blog is the RRG Chartsblog. If you would like to receive a notification when a new article is published there, simply "Subscribe" with your email address.
Julius de Kempenaer
Senior Technical Analyst, StockCharts.com
Creator, Relative Rotation Graphs
Founder, RRG Research
Want to stay up to date with the latest market insights from Julius?
– Follow @RRGResearch on Twitter
– Like RRG Research on Facebook
– Follow RRG Research on LinkedIn
– Subscribe to the RRG Charts blog on StockCharts
Feedback, comments or questions are welcome at Juliusdk@stockcharts.com. I cannot promise to respond to each and every message, but I will certainly read them and, where reasonably possible, use the feedback and comments or answer questions.
To discuss RRG with me on S.C.A.N., tag me using the handle Julius_RRG.
RRG, Relative Rotation Graphs, JdK RS-Ratio, and JdK RS-Momentum are registered trademarks of RRG Research.
Julius de Kempenaer
Senior Technical Analyst, StockCharts.com
Creator, Relative Rotation Graphs
Founder, RRG Research
Host of: Sector Spotlight
Please find my handles for social media channels under the Bio below.
Feedback, comments or questions are welcome at Juliusdk@stockcharts.com. I cannot promise to respond to each and every message, but I will certainly read them and, where reasonably possible, use the feedback and comments or answer questions.
To discuss RRG with me on S.C.A.N., tag me using the handle Julius_RRG.
RRG, Relative Rotation Graphs, JdK RS-Ratio, and JdK RS-Momentum are registered trademarks of RRG Research.


