It was a tough week for investors following last week's sharp drop in the markets, particularly as many individual stocks sold off even more than the averages. Selling was broad-based and on heavy volume, with the Dow Jones Industrial Average experiencing its biggest decline since the October 2008 banking collapse as coronavirus fears gripped the markets.
The relentless selling subsided on Friday, however, and a close look at that day's trading action points to a good chance that we may see a bounce into next week. Heavy buying on what was the market's 7th straight day of declines had the S&P 500 bullishly closing in the very upper portion of its trading range for the day.
Other near-term bullish factors also emerged - you can review them in my most recent MEM Edge Show here.
INTRADAY CHART OF GENERAL ELECTRIC (GE)
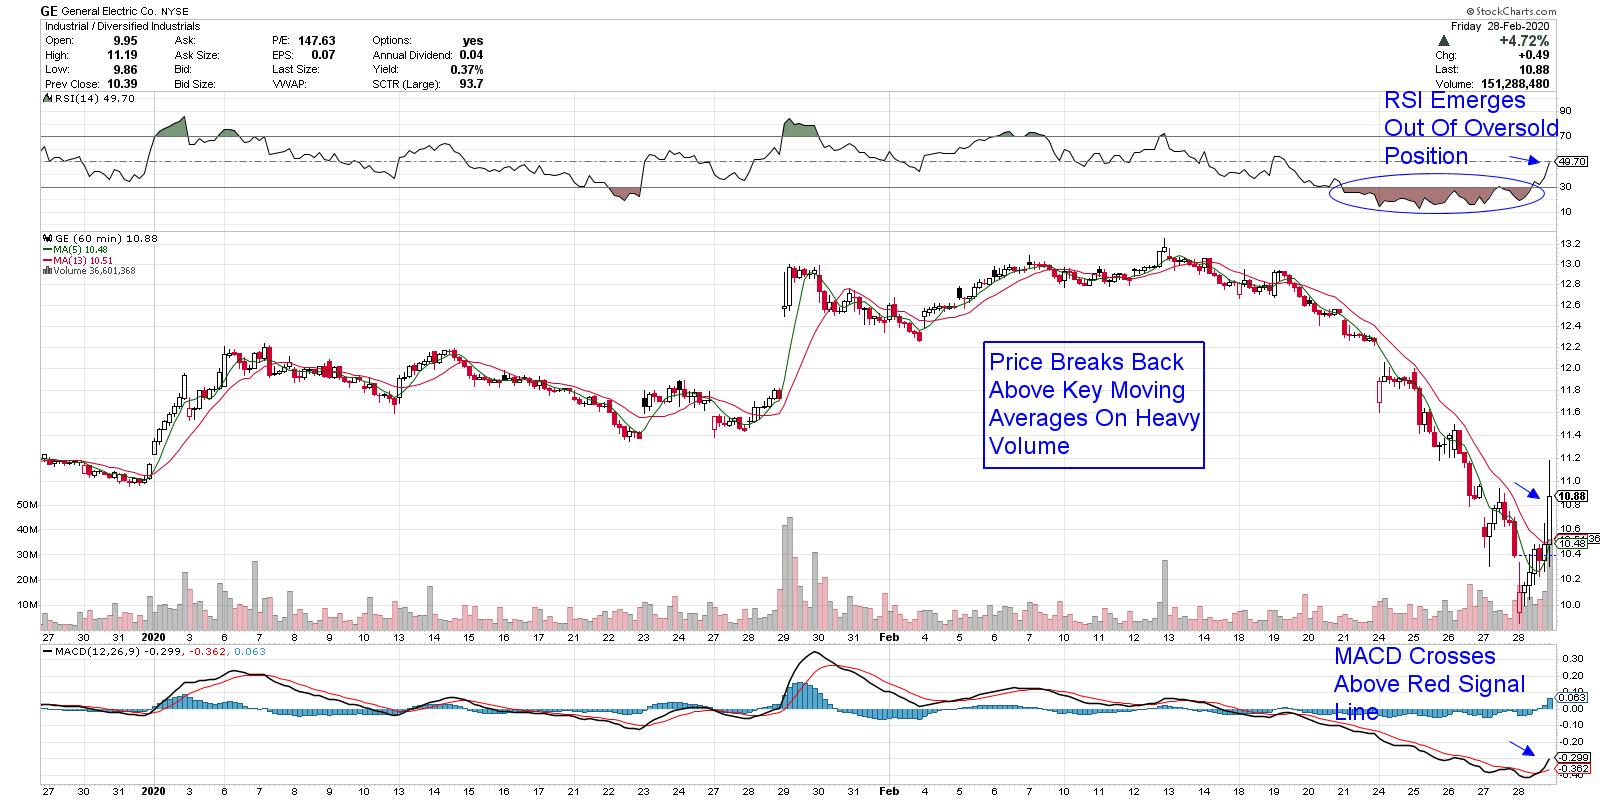
The first name that's due for a bounce is General Electric (GE), which got hammered during the coronavirus-inspired selloff, dropping as much as 26% before buyers came in and supported the stock. On a daily chart, GE bullishly closed on Friday back above its key 200-day moving average.
As with the other selected stocks in this article, I've marked up the intraday chart to highlight positive signals for the very near-term outlook. As you can see, the RSI is a hair away from turning positive, while the MACD bullishly crossed up above its signal line. Lastly, GE's rally on Friday bullishly pushed the stock back above its 5- and 8-hour moving averages.
INTRADAY CHART OF SHOPIFY INC. (SHOP)

Shopify (SHOP) is in an even more positive position to rally, after closing the week back above its key 50-day moving average following a Friday rally. The stock had been a huge year-to-date winner before peaking in price in mid-February. The 2-week selloff in the stock pushed it down as much as 30%, despite analysts raising earnings estimates.
On the intraday chart, the RSI for Shopify is now positive while the MACD has had a positive crossover. In addition, the price action on Friday pushed the stock back above its near-term moving averages.
INTRADAY CHART OF TRANSDIGM GROUP INC. (TDG)

The slump in Transdigm Group (TDG) began even earlier than the other candidates, as the stock peaked in price in early February despite reporting strong earnings and sales that had analysts raising guidance going forward.
The stock slumped more than 20% over the past 3 weeks before finding support at its 200-day moving average on Friday. It also bullishly closed in the very upper portion of its range for the day. On the intraday chart, the RSI is close to turning positive while emerging from an oversold position, and the MACD has had a positive signal crossover. In addition, the volume during the stock's break back above key moving averages is very impressive.
While the broader markets appear poised for a bounce, the longer-term outlook remains murky. Until we have a clearer picture of the coronavirus's true impact on global growth, we can expect the uncertainty that's been pushing the market's down to remain.
In the meantime, those interested in participating in a possible bounce in the markets will want to put alerts in place so that, if your stock breaks back below those ultra-short-term moving averages and negative RSI and MACD signals emerge, you can safely exit. This would be using an intraday chart.
For those who'd like insightful alerts regarding the broader markets during this difficult period, I urge you to take a 4-week trial of my MEM Edge Report for a nominal fee. In addition to being alerted to when the current downtrend has reversed, you'll receive regular updates on the markets complete with entry and exit points of high-quality growth stocks as the markets warrant.
Next week, I'll be a panelist with 5 other experts who'll share their strategies for the current market environment. The event will be at no cost and you can receive a recording if you can't make it live. For more information, CLICK HERE.
Warmly,
Mary Ellen McGonagle