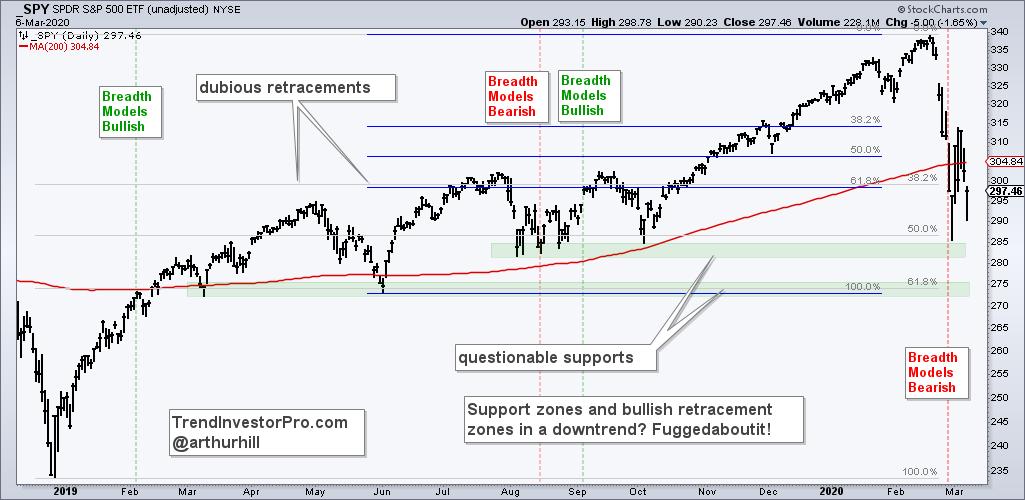
 Support levels and bullish retracement zones are questionable, at best, in bear market environments. Why? Because the path of least resistance is down in a bear market. As such, the odds that a support level holds or a bullish retracement zone leads to a reversal are greatly reduced. The odds favor bearish outcomes and bearish resolutions during bear markets.
Even though the S&P 500 is battling its 200-day SMA this week, I am in bear market mode because the breadth models at TrendInvestorPro.com turned bearish for the first time since early September. This means support levels and bullish retracement zones are much less realiable.
As the chart below shows, I could mark support based on the August-October lows or even the March-June lows. In addition, I could draw Fibonacci retracements from the December 2018 low to the February high or from the May low. I could, but these levels simply offer false hope and ignore the shift from bull market to bear market. Instead, I will simply ignore support and bullish retracement zones for now.
Resistance levels and bearish retracement zones, on the other hand, are more important in a bear market environment. With a pop and drop this week, SPY reversed in its first bearish retracement zone and established its first resistance zone.
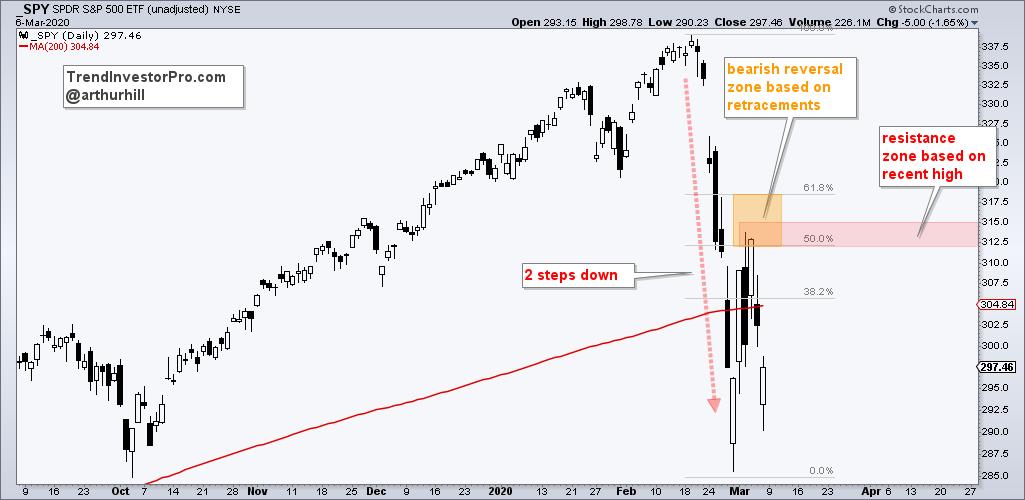
The chart above shows SPY closing just above the 50% retracement on Wednesday and then falling back towards the prior lows. A 50-61.8% retracement is normal for a counter-trend bounce. Think of it as two steps backward (down) and one step forward (rebound). The decline also establishes a reaction high near 315 and this becomes the first resistance to watch going forward.
Click here for the companion video on the TrendInvestorPro Youtube Channel
Each week at TrendInvestorPro.com we assess the state of the stock market with our index and sector breadth models. With clear signals and levels, these offer an objective weight-of-the-evidence approach to broad market timing. This week's analysis of the core ETF chart-list shows many more downtrends than uptrends and a correlation matrix gives us an idea of what to expect from defensive sectors.
Click here to take your analysis process to the next level!
------------------------------------------
Choose a Strategy, Develop a Plan and Follow a Process
Arthur Hill, CMT
Chief Technical Strategist, TrendInvestorPro.com
Author, Define the Trend and Trade the Trend
Want to stay up to date with Arthur's latest market insights?
– Follow @ArthurHill on Twitter


