Back in December, I wrote an article pointing out that the business cycle was nothing more than a set series of chronological sequences. The importance of this observation, for investors, is that the primary trend peaks and troughs of bonds, stocks and commodities fit nicely into that chronology, as shown in Figure 1. At that time, my models for the three markets indicated that the the cycle was likely somewhere in the green-shaded area. They still do. The diagram implies that the US economy is emerging from a recession, but, clearly, that's not the case. However, since the last recession, which ended in 2009, the economy has undergone three growth slowdowns, which were all associated with that bond, stock, commodity chronological turning point sequence.
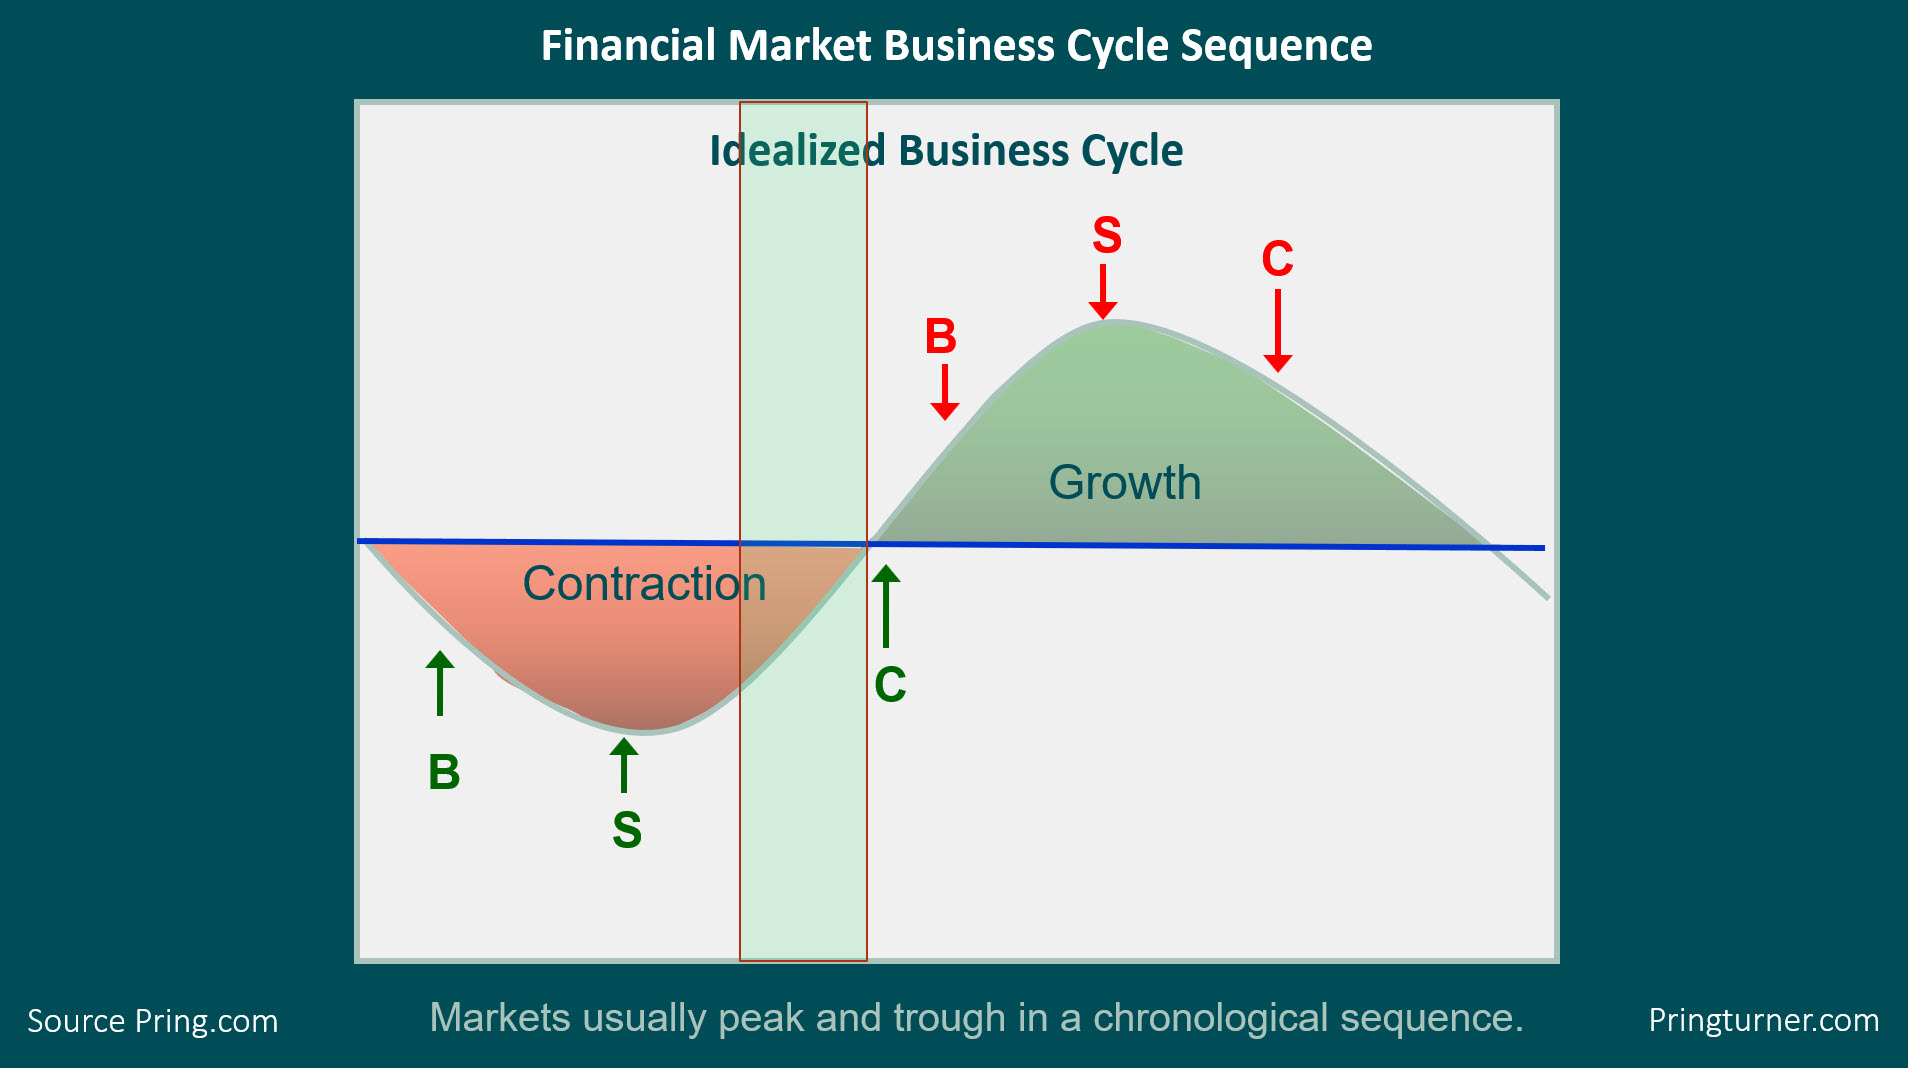
Figure 1
My work shows that the latest slowdown, which began around at the end of 2017, now appears to be ending. Since bonds and stocks are already in a confirmed bull market, the next event to look out for is a bottom in commodities. Last December, it seemed that commodities were just about to break to the upside, but the confirmation that I called for never happened. That confirmation was a month-end close in the CRB Composite above 190, which would have taken it above the green down trendline in Chart 1. Instead, the CRB experienced a sharp drop due to economic fears concerning the coronavirus. Now, it is back to support just above the red trendline. In the meantime, nothing has yet changed for the worse on the economic front; indeed, things have actually improved.
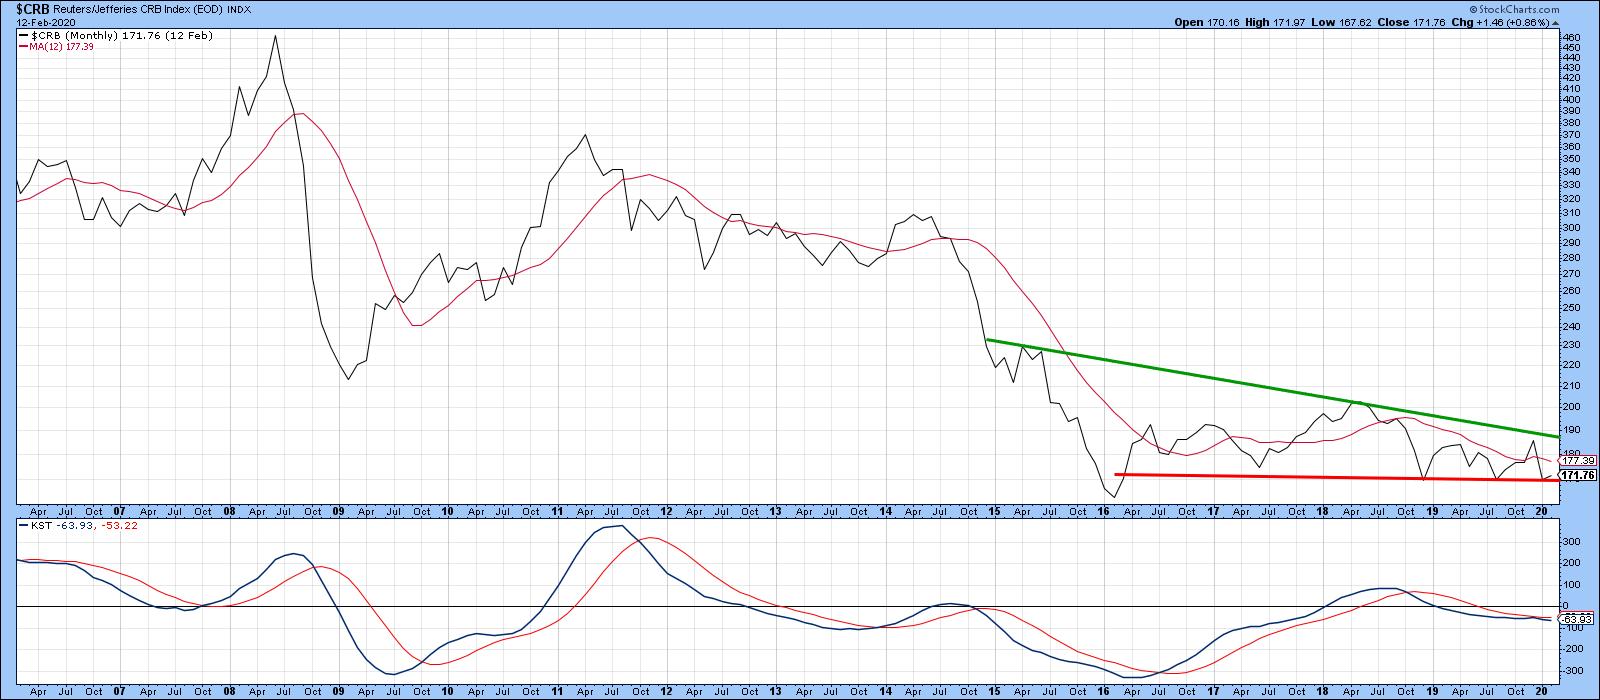
Chart 1
In that respect, Chart 2 shows that housing starts, a very long leading economic indicator due to their sensitivity to interest rates, literally exploded in the last couple of months. This is also reflected in its KST. This series has now reversed sharply to the upside, yet remains at a subdued level, meaning that it has plenty of upside potential until it gets to its traditional warning level. Ironically, the recent drop in commodities has had a stimulating effect on housing, since the drop was accompanied with a decline in rates themselves. Swings in the housing start numbers are not very helpful in forecasting commodity trends. However, since they are a forward-looking indicator, they are of invaluable help in forecasting trends in other parts of the economy. Chart 2, for instance, shows that housing start momentum consistently leads that for industrial production, a coincident indicator at peaks.
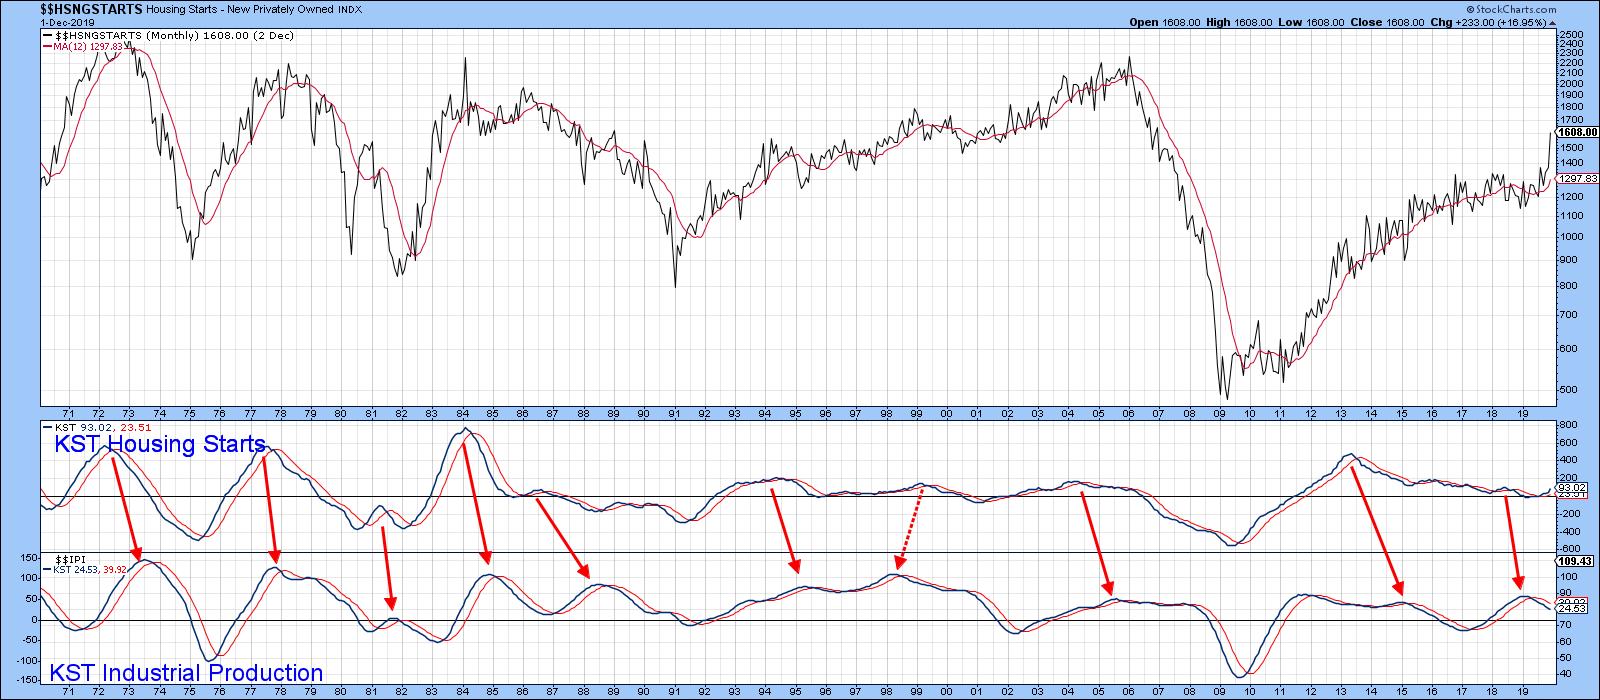
Chart 2
On the other hand, Chart 3 demonstrates that same leading characteristic at bottoms. If the normal sequence repeats again, I would expect to see the KST for Industrial Production soon reverse to the upside.
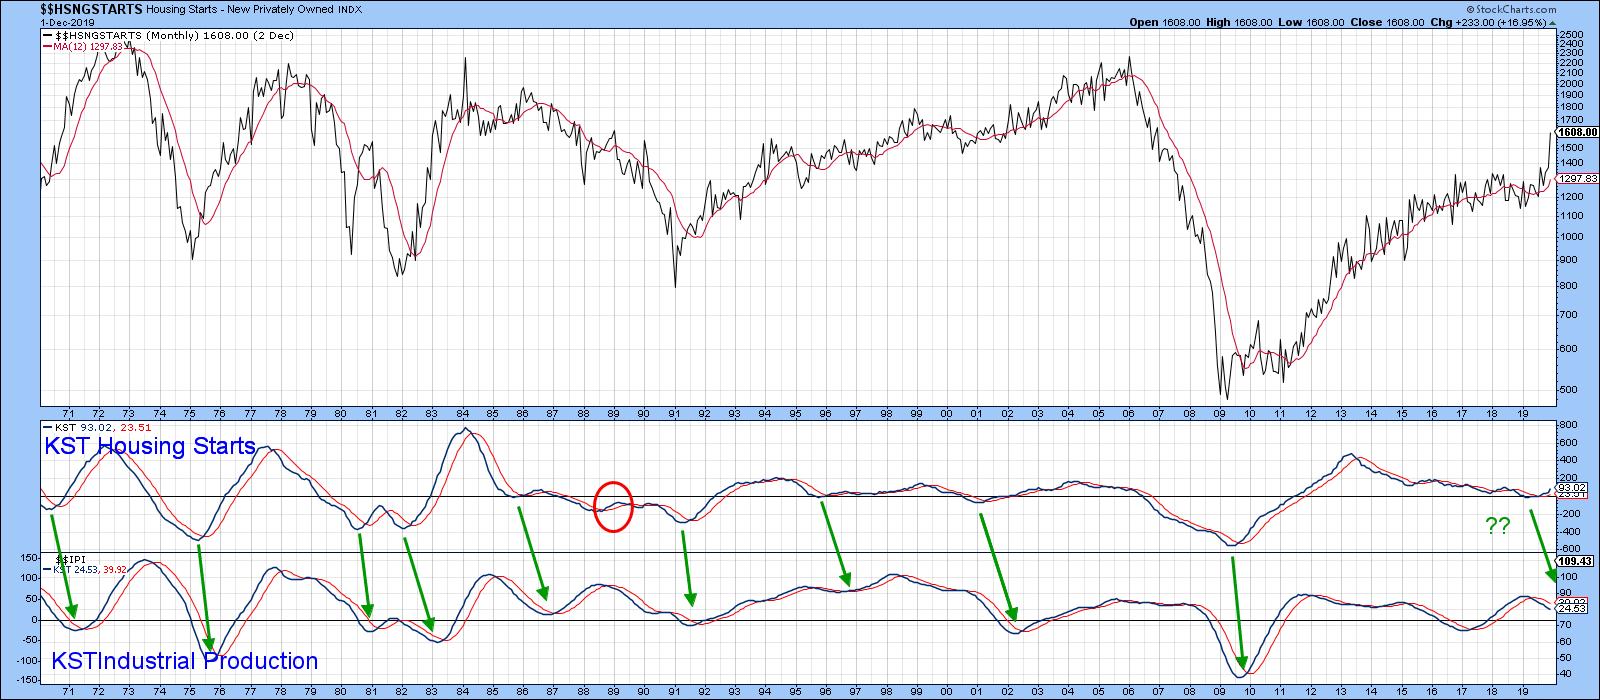
Chart 3
That's important for commodities, because Chart 4 tells us that upside reversals in industrial production momentum are consistently associated with major commodity buying opportunities. All indicators and relationships fail from time-to-time. The two dashed arrows show that this one is no exception, given two failed signals in 1981 and 2014. Note also that, in the majority of cases, lows in production momentum lag the actual bottom in the CRB by a few months.
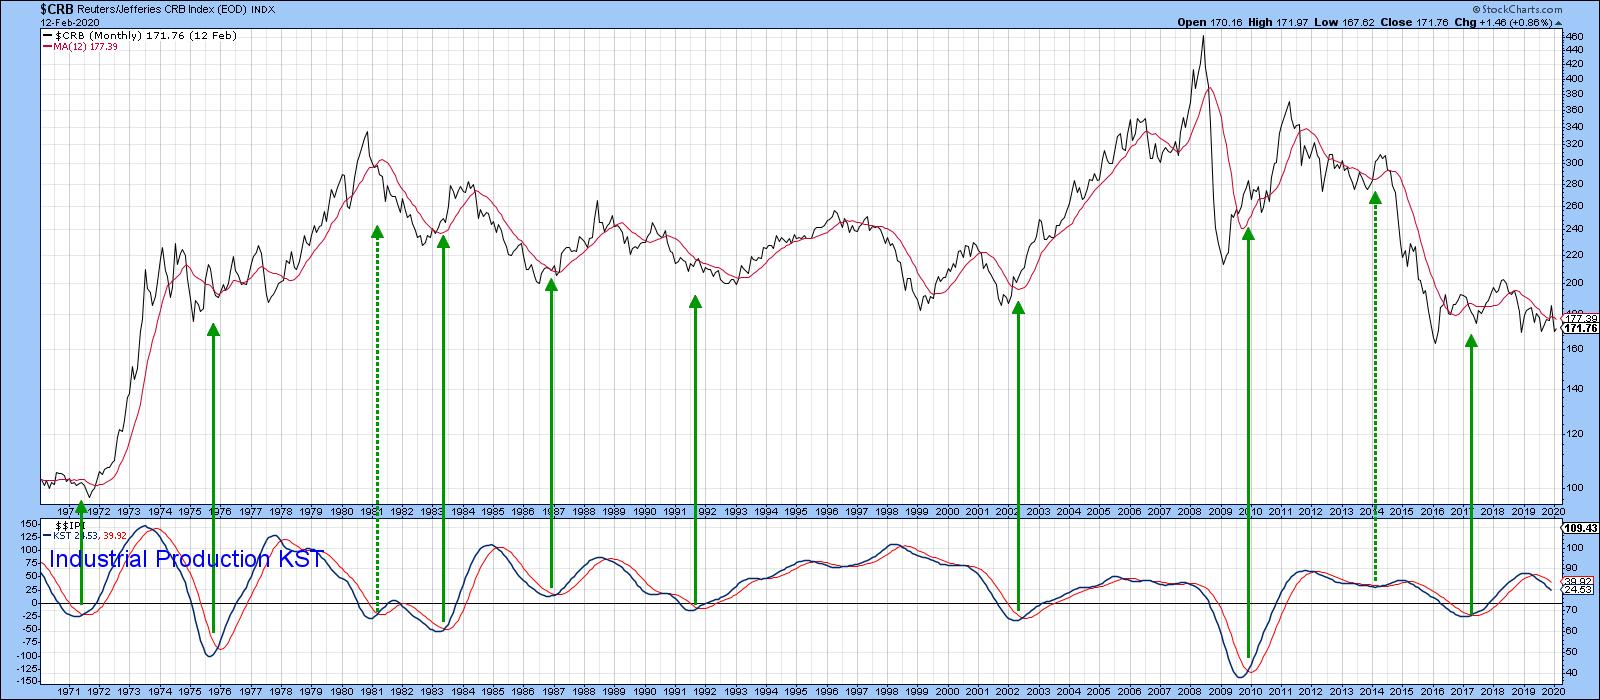
Chart 4
Editor's Note: This is an excerpt of an article that was originally published in Martin Pring's Market Roundup on Wednesday, January 29th at 1:29pm ET. Click here to read the full article, which includes Charts 5-8 and a discussion of the DB Commodity ETF.
Good luck and good charting,
Martin J. Pring
The views expressed in this article are those of the author and do not necessarily reflect the position or opinion of Pring Turner Capital Group of Walnut Creek or its affiliates.


