Embrace this rally.
As far as bull markets go, this is truly the Perfect Storm. Never in my lifetime have I seen a stock market environment where we're experiencing modest growth, strong jobs, lower-than-target inflation, historically-low treasury yields and a Fed that honestly should cut rates again. If you're on the sidelines, I understand the frustration of seeing the stock market go up day after day, week after week and month after month. But it ain't over. In fact, I still believe the best is yet to come. The huge gains that we've seen isn't a bubble. It's an attempt to begin to reprice stocks experiencing huge earnings growth in a very low interest rate environment. Throw out your PE analysis and historical comparisons - unless you can show me another period in history where we've seen the type of market environment that I just described above.
Yes, this secular bull market will end ugly, just as every other one has. We might be 10-15 years away from it, though. Are you prepared to sit it out?
I wrote a recent article in my Trading Places blog titled "Perspective: That's What The Bull Market Naysayers Are Lacking". You might want to read that if you haven't already. I simply made the point that many technicians/analysts are comparing the current market environment to the top in 2007, which is a HUGE mistake, in my opinion. We'd be much better served comparing this secular bull market to our last secular bull market, from 1981 to 2000. Before I do that, however, let's simply take a look at the S&P 500 monthly chart and check out where the monthly PPO and RSI currently reside:
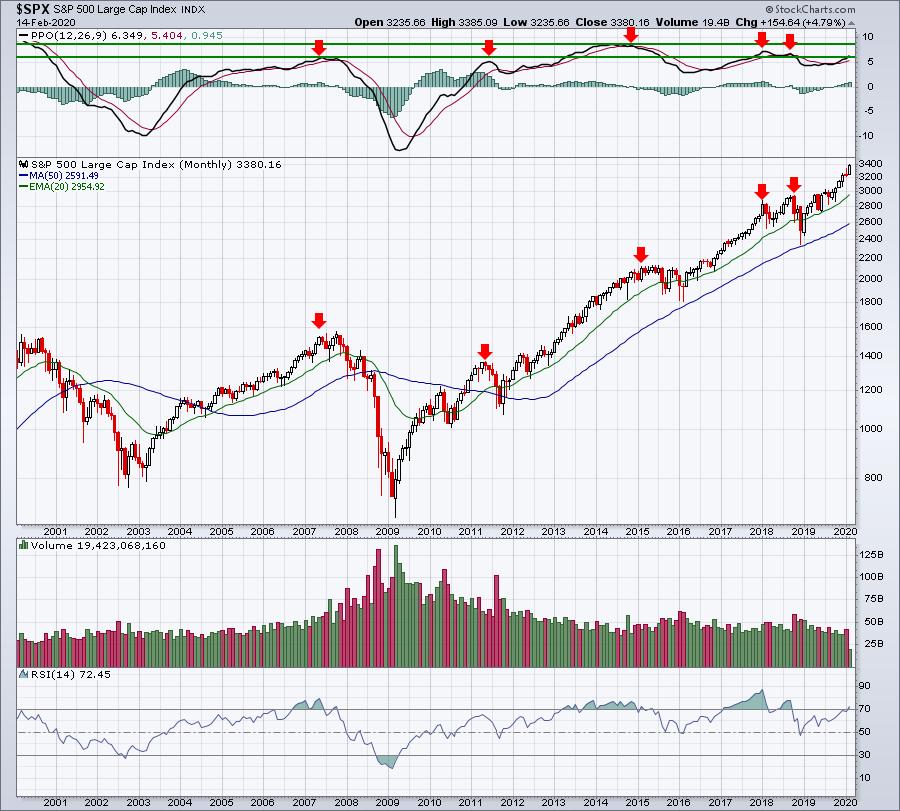
In secular bear markets, PPO readings at 6 are cause for concern. In secular bull markets, not so much. The current monthly PPO reading is 6.35. I checked the monthly PPO number for every month from January 31, 1983 to March 31, 2000. Want to know the average monthly PPO reading during that entire secular bull market? 7.10! That's the average. Of the 207 months that spanned that secular bull market, 110 months had monthly PPO readings above 6. More than half! We look at the above chart and we're trained to believe that the U.S. stock market cannot get any better than this. Well, I've got news for you. This is just the beginning.
Let's take a trip down memory lane and look at what's more typical of a secular bull market:
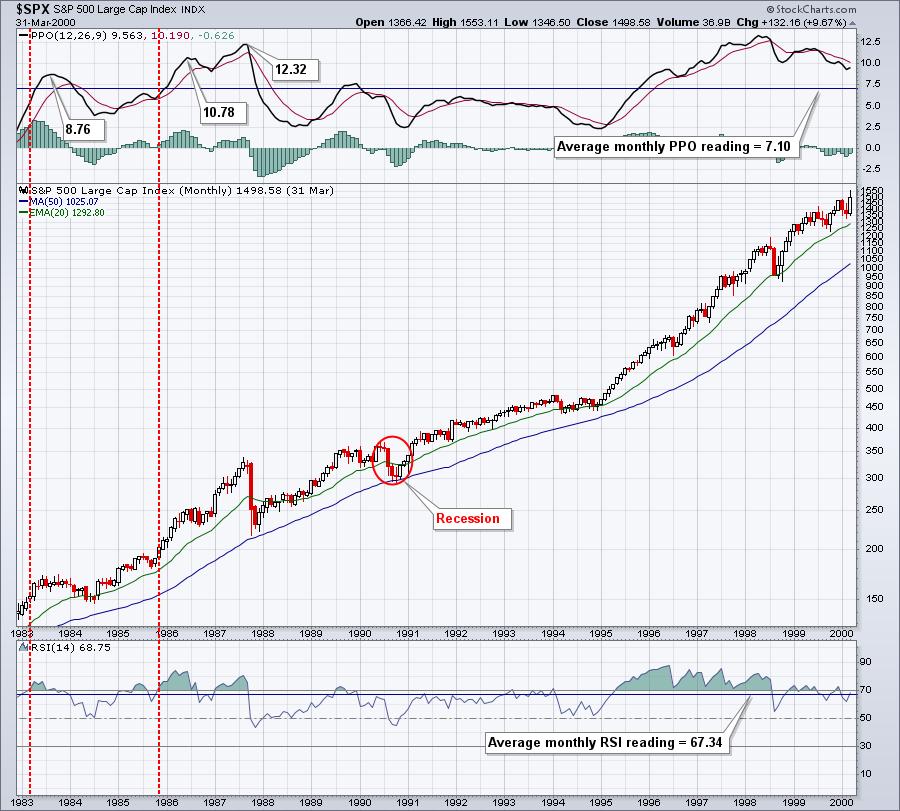
1983, 1986 and 1987 all posted monthly PPOs well above the current level. So, while we could be near a PPO top for this century, we're really not close to where we could go.
The monthly PPO is the percentage difference between the 12-month EMA and the 26-month EMA. The purpose of this analysis is to simply say that we could see this bullish momentum accelerate significantly from where we are. I understand that might seem unfathomable to many, but I wanted to make sure you understand the difference between overbought in a secular bull market vs. overbought in a secular bear market.
So what's the driver behind this crazy bullishness? It's earnings growth in a historically low interest rate environment. I believe our economy will grow stronger throughout 2020, with earnings growth surging in many companies. Throw in the bond market screaming at the Fed to lower rates (and they will later in 2020 - watch and see) and we have NIRVANA for U.S. equities. So how high will we go? That's honestly impossible to answer. However, I am confident about a few things. First, I'm on record saying that I believe the S&P 500 will hit 4000 in 2020. We've been on a tear and are now closing in on 3400. I'll also say this. Based on all of my historical research, and my belief that we're in a secular bull market that could last into the 2030s (with a possible recession or two along the way), I see the S&P 500 reaching 10,000, essentially tripling from its current level, before this decade ends. This is all just my opinion and, of course, I could be completely wrong, but I don't think so. I wouldn't sit this out, waiting on a bear market or a recession to hit. You might be waiting awhile.
Stock selection will be critical, however. Stick with relative strength leaders in rapidly growing industries. That's EXACTLY what our portfolios are designed to do. I've developed four portfolios - Model, Aggressive, Income, and Character Change. The latter was just started less than 3 months ago and is trailing the benchmark S&P 500 for a number of reasons, the primary one being that this portfolio is invested in small-cap and mid-cap stocks, which are badly lagging the S&P 500 over the last quarter. But the other three have performed spectacularly. Here's a quick performance analysis of each:
Model Portfolio
I began selecting 10 equal-weighted stocks in 10 different industry groups on November 19th, 2018. Since then, I've replaced the 10 stocks every three months. Each time, I do my homework to find 10 relative strength winners and I concentrate almost exclusively in industries that are outperforming the S&P 500. The results to date have been sparkling. In 15 months, my Model Portfolio has returned 58.25% while the benchmark S&P 500 has returned 25.62% over the same 15 month period.
Aggressive Portfolio
On May 19th, 2019, I added the Aggressive Portfolio, which concentrates primarily in small- and mid-caps. Despite the lagging performance of those two asset classes since May, the Aggressive portfolio has returned 21.59%, exceeding the S&P 500's return of 18.21%. I can only imagine how this portfolio might perform if small- and mid-cap stocks were to actually lead the S&P 500.
Income Portfolio
This portfolio was also established on May 19th, 2019. Its component stocks are mostly household names that typically pay dividends in the 1.50%-2.50% range. It was designed to provide our risk-averse members an alternative to the Model and Aggressive portfolios, both of which tend to move much more rapidly in both directions. Since its inception, the Income portfolio has gained 23.79%, easily outpacing the S&P 500's return of 18.21%. That's more than 5.5 percentage points in just under 9 months - not bad at all.
On Wednesday, February 19th, at 5:00pm EST, I'll be announcing the 10 stocks that will comprise each of these four portfolios for the next three months, based off their outstanding quarterly earnings results that were recently announced and their outstanding relative strength. I only want to own the best of the best. All of our members have a seat to this event guaranteed, even our trial members. If you'd like to join me and the rest of our EarningsBeats.com community, CLICK HERE for more information.
Happy trading!
Tom


