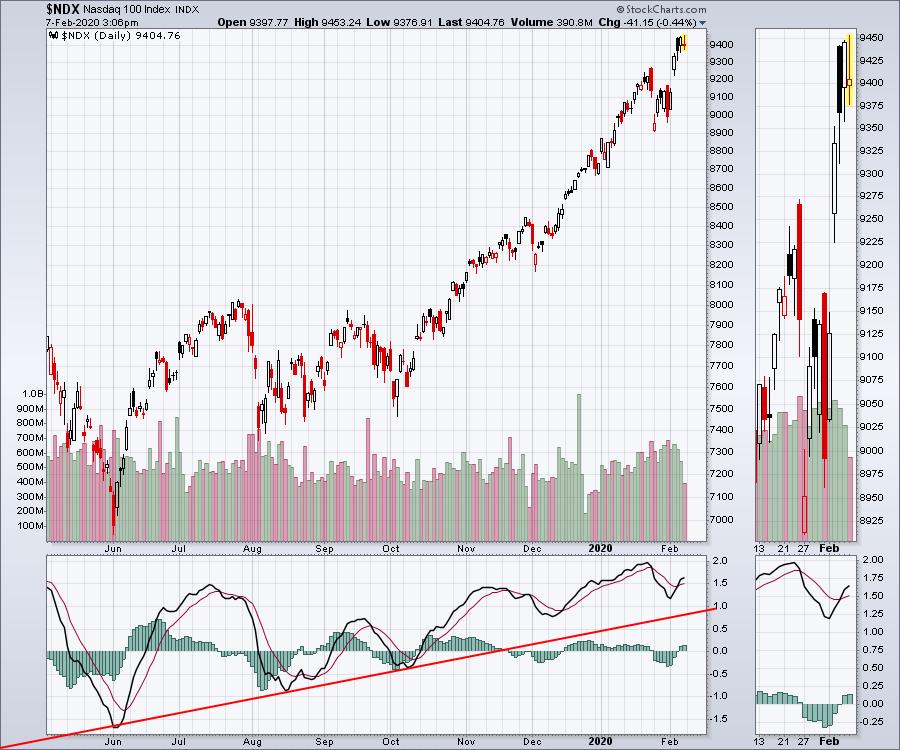
While it is only a week, it was a crackin' bounce in the high-flyers club. The bulls trotted a trail of optimism that the drive-by-shooting caused by the coronavirus was a big buying opportunity on the back of more Fed and Chinese liquidity injections. That liquidity seems to be flowing into the large caps, as the world migrates into a smaller collection of names to trust in weak times. It also seems to be replay of the Nifty 50 in India back in the day. But the Nasdaq 100 chart ($NDX) soared on Monday, Tuesday and the Wednesday morning open. On Thursday, it worked all day to keep climbing while Friday ended up being a bit of exhaustion.
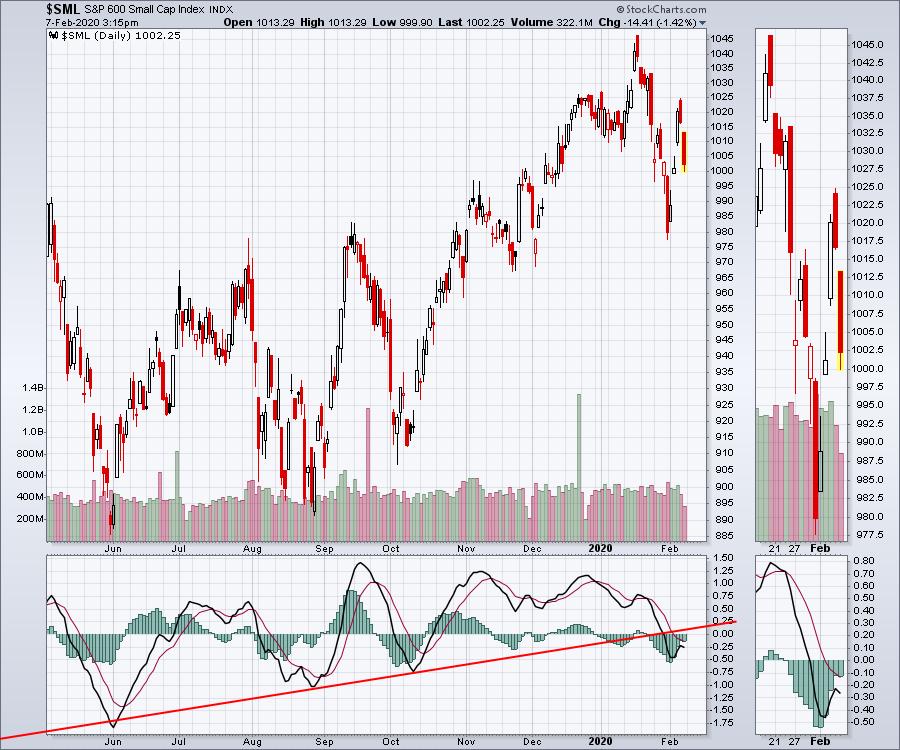
Small caps tried to follow the indexes to higher ground, but so far they have failed to reclaim the old highs. The momentum trend line on the PPO has also been broken. What we're seeing is the market bifurcating into large-cap huddles and small-cap dispersion.
This is also being shown on the VEU and EEM charts for Friday. The EEM had two black candle days where it opened higher and closed lower than the open, but closed above the previous day.
With the investors narrowing their focus, it is more important than ever to keep gains on a tight leash. While caution is always prudent, my indicators haven't flipped back to bullish after last week's drop. Tesla (TSLA) share buyers buying in at over $900/share masked some weakness underneath other names. Now that the euphoria has dissipated for a few days, the market weakness in some large caps started to show on Friday in the Dow Jones Industrials ($INDU) with a 300-point drop. Those are large caps letting go after creating a short term double-top. This seems to be the median between the Nasdaq 100 and the small caps.
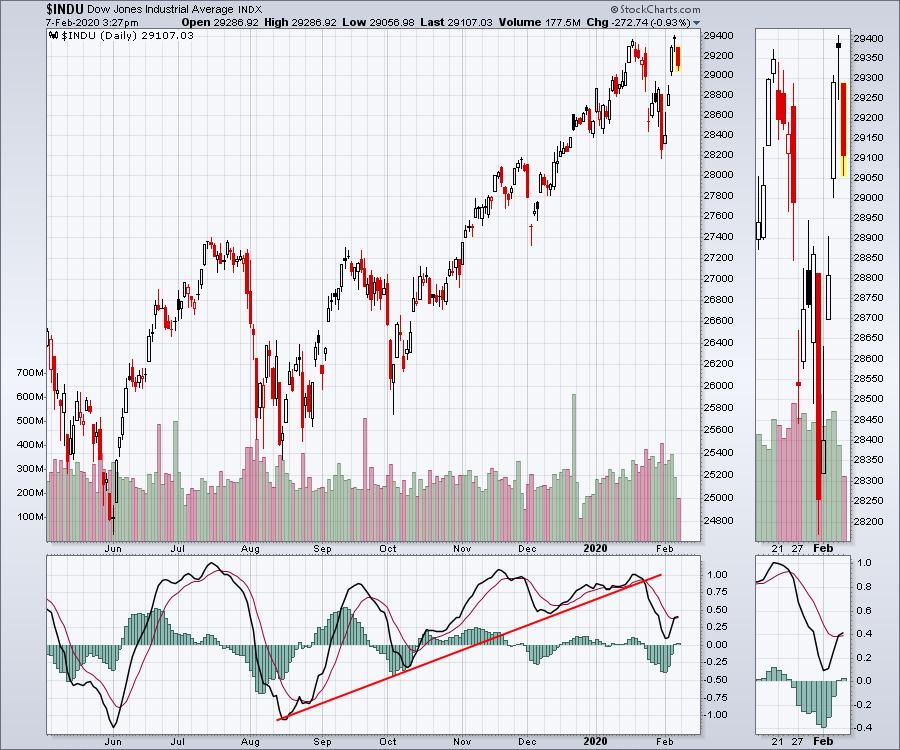
Stay flexible, as the big jobs number was not enough to float the boat Friday. That seems cautionary in itself. But if large caps start to follow the rest of world down, don't be surprised if we start making faster, aggressive moves lower rather than a slow descent.
Good trading,
Greg Schnell, CMT, MFTA
Senior Technical Analyst, StockCharts.com
Author, Stock Charts For Dummies
Want to stay on top of the market's latest intermarket signals?
– Follow @SchnellInvestor on Twitter
– Connect with Greg on LinkedIn
– Subscribe to The Canadian Technician
– Email at info@gregschnell.com


