Are the markets oversold? Yes.
Is it reasonable to expect that next week will see the markets recover at least a bit after this week's mayhem? Absolutely. But here are three charts suggesting that any short-term market bounce will most likely be followed by further downside for stocks.
First, we have to remember that indexes like the Dow Jones Industrial Average ($INDU) are not just oversold but extremely oversold, with an RSI below 20. This is actually incredibly rare.
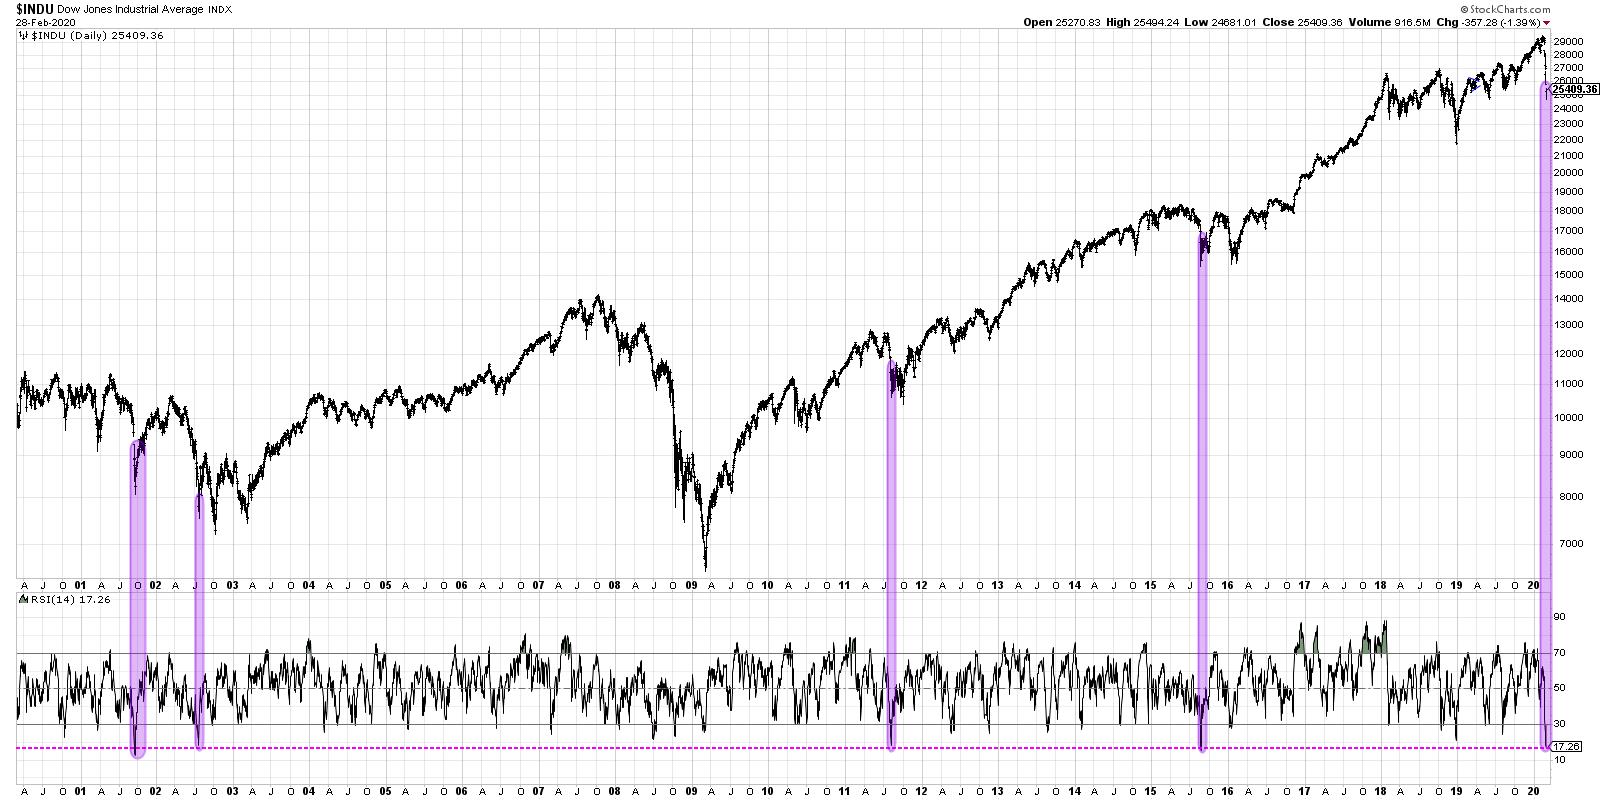
This has only happened four other times since the March 2000 market peak. In every one of those cases, the market at least retested the low and, in three of the four, the Dow actually saw a lower low in the next 3-8 months.
So, while an oversold condition usually suggests short-term upside for any market, the extreme oversold condition actually has often identified elevated risk for further downside.
Second, we now have over half the S&P 500 index trading below their 200-day moving averages.
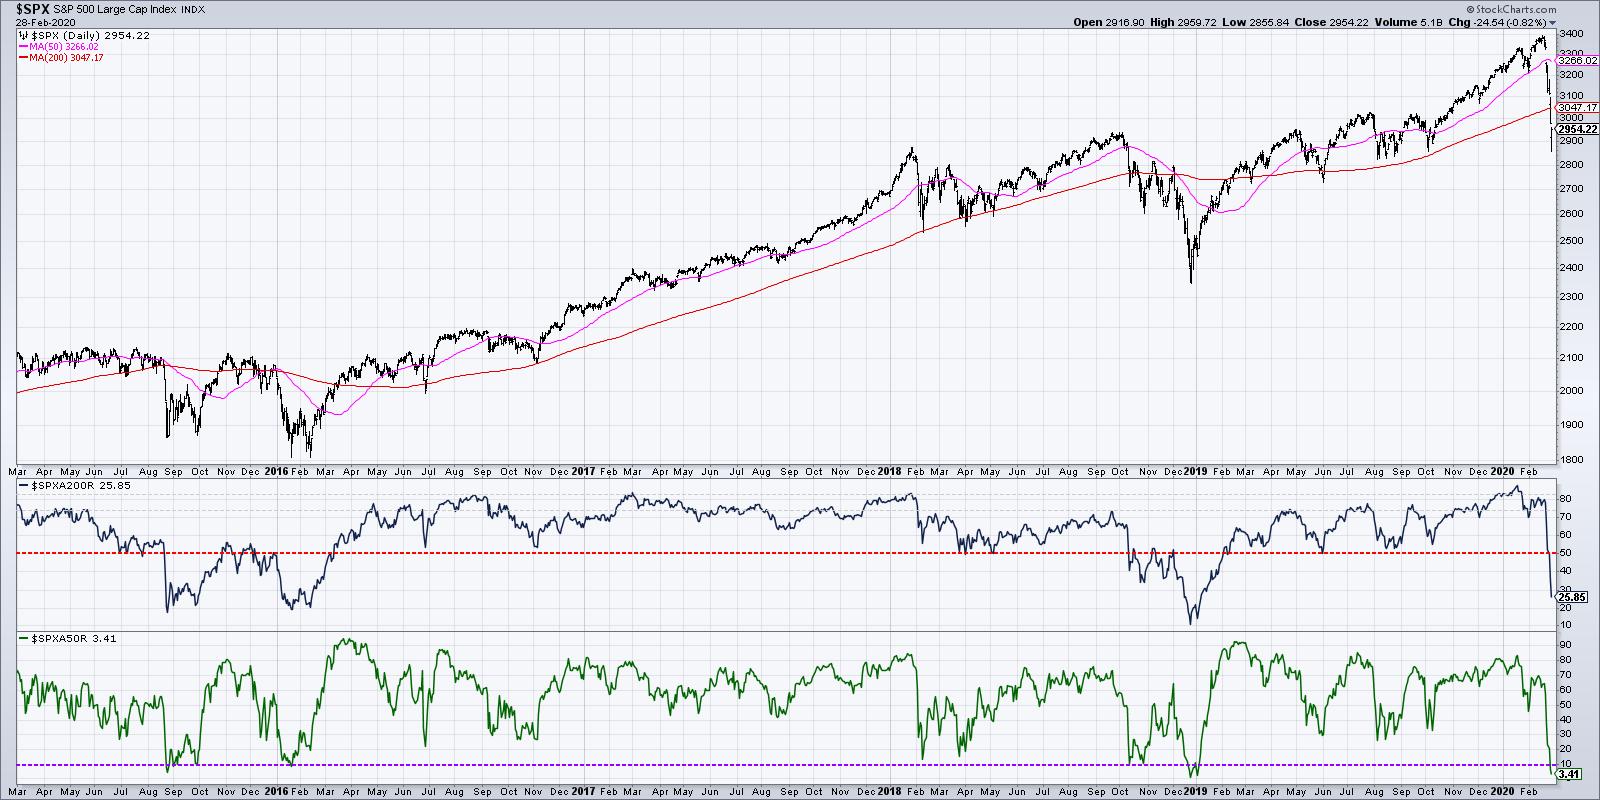
In shorter cyclical pullbacks, this key breadth indicator has stopped at the 50% level. This would mean that half of the S&P members have remained above their 200-day moving average.
As of this Friday, only 26% of the S&P stocks remain above their 200-day, which now it puts in rare company this week. This breadth breakdown has only happened two other times since 2014; in both cases, this identified deeper market declines.
It's worth noting that, in the 2012-2015 period, this "50% sell" signal happened three times. In each case, the market recovered quickly. The difference there is that the S&P 500 never confirmed a breakdown of its own 200-day moving average during that period.
Finally, we have the 52-week highs and lows. As of Friday, 20% of the S&P 500 stocks had established a new 52-week low.
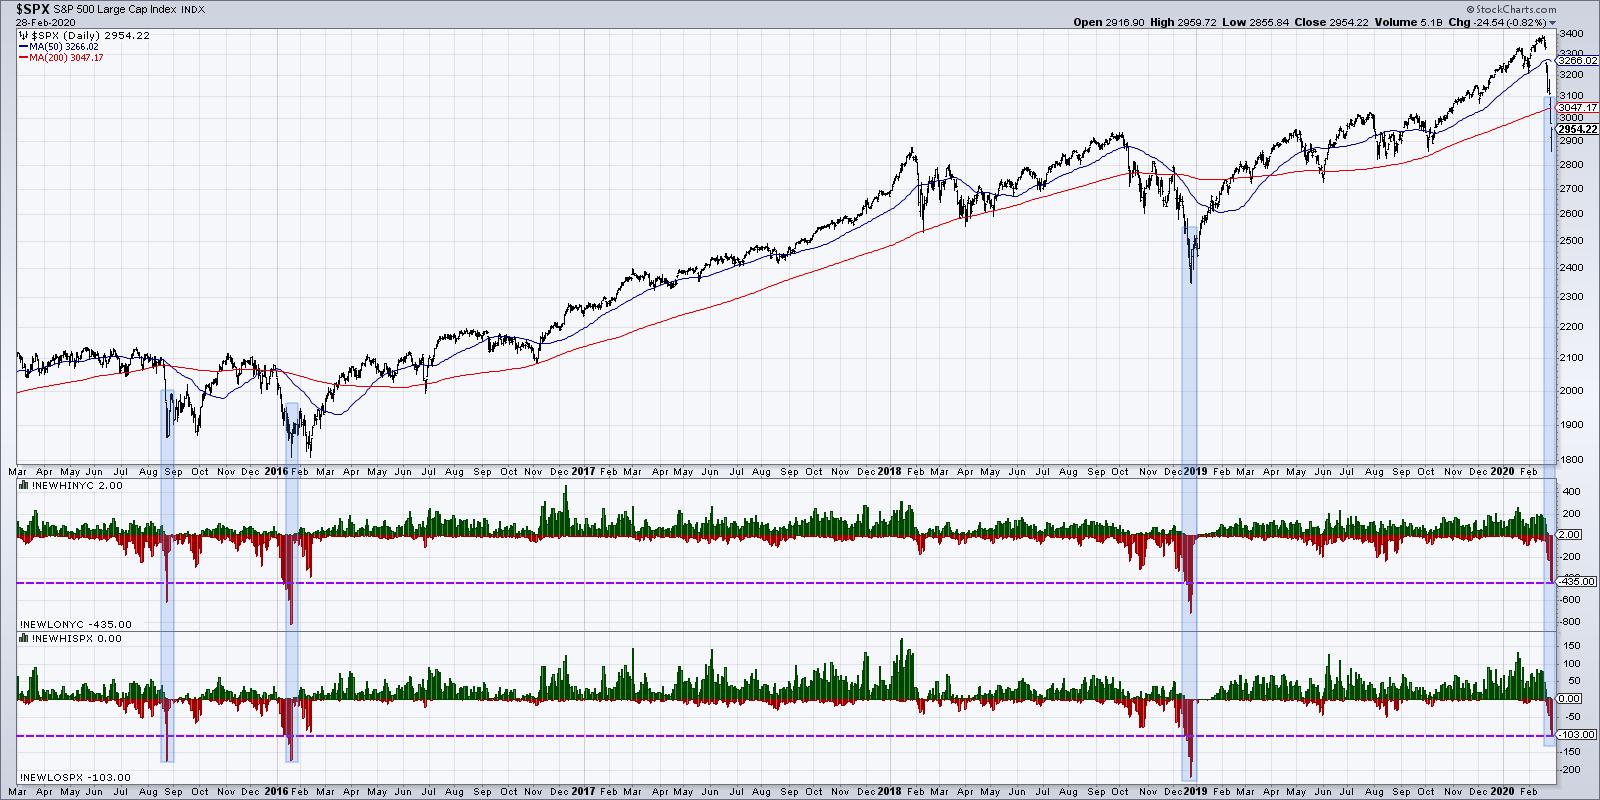
Here, we're showing the S&P 500 index, followed by the new 52-week highs and lows on the New York Stock Exchange (middle panel) and the 52-week highs/lows for the SPX (bottom panel).
This extreme low reading has only happened three other times since 2014. The first two times were in 2015 and 2016, in which the market moved lower in both instances. The opposite occurred at the 2018 market low, when over 200 S&P names reached a new 52-week low and the market completed a V-bottom soon after. The difference there is that the SPX had already been in a severe decline off the October 2018 peak, as opposed to the one-week decline we've experienced thus far in February 2020.
So there are three charts illustrating how the current market is showing similar characteristics to other cyclical declines. Is this is a guarantee that the market will move lower? Of course not.
But the greatest value of charts, in my opinion, is the benefit of market history. Long-term charts help you put the current market environment into proper historical context.
Based on these three charts, I would not be surprised to see a brief recovery followed by further downside.
RR#6,
Dave
David Keller, CMT
Chief Market Strategist
StockCharts.com
Disclaimer: This blog is for educational purposes only and should not be construed as financial advice. The ideas and strategies should never be used without first assessing your own personal and financial situation or without consulting a financial professional.
The author does not have a position in mentioned securities at the time of publication. Any opinions expressed herein are solely those of the author and do not in any way represent the views or opinions of any other person or entity.


