During tumultuous times like these, I pay particular attention to sentiment levels. Extreme fear tends to mark market bottoms, just as the recent Volatility Index ($VIX) reading above 80 coincided with this week's stock market bottom. It's simply the way bottoms form.
However, last week we saw a major rebound in U.S. stocks. It was the "rubber band" effect. Losing one third of the entire market capitalization has generally resulted in a typical Fibonacci rally, which is exactly what we saw last week. The Dow Jones climbed 20% over just three trading days - its biggest advance since the 1930s. While that may sound absolutely incredible, it needs to be viewed with perspective - it came on the heels of the biggest 5-6 week stock market decline in my lifetime.
Now let's focus on reality. The Dow Jones closed at 29551.42 on February 12th. Six weeks later (!!!), the Dow Jones closed at 18,591.93, a jaw-dropping decline of 11,000 points. That's a loss of 37% of the market capitalization of 30 U.S. conglomerates........ in 6 weeks!!!
Is it too much? OF COURSE IT IS!!! More than one-third of the value of all U.S. stocks in 6 weeks? That's C-R-A-Z-Y! But, unfortunately, it's the way the stock market works. When uncertainty is in the air, Wall Street takes a "sell first, ask questions later" mentality. It always overshoots to the downside, which is why extreme fear marks bottoms.
So should we rush in and buy stocks now on sale? Well, it depends. In my opinion, those with a long-term mentality should be absolutely jumping at this opportunity. After all, isn't this what everyone wanted when the Dow Jones was knocking on the door at 30,000? But now that it's here, it's difficult to pull the trigger. Welcome to this emotional roller coaster!
A long-term investor should be buying this weakness without a doubt. Prices are historically cheap when massive fear hits the market. But what should traders do? Will we get an opportunity to get in at lower levels?
I say yes.
Rarely do we see equities print "V-bottoms." Q4 2018 was an example of a V-bottom, but they are very rare. I believe we'll see a minimum of a double bottom, testing the earlier price low on our key indices. I won't say with certainty that the short-term top is in, but we definitely approached a key Fibonacci level on the S&P 500:
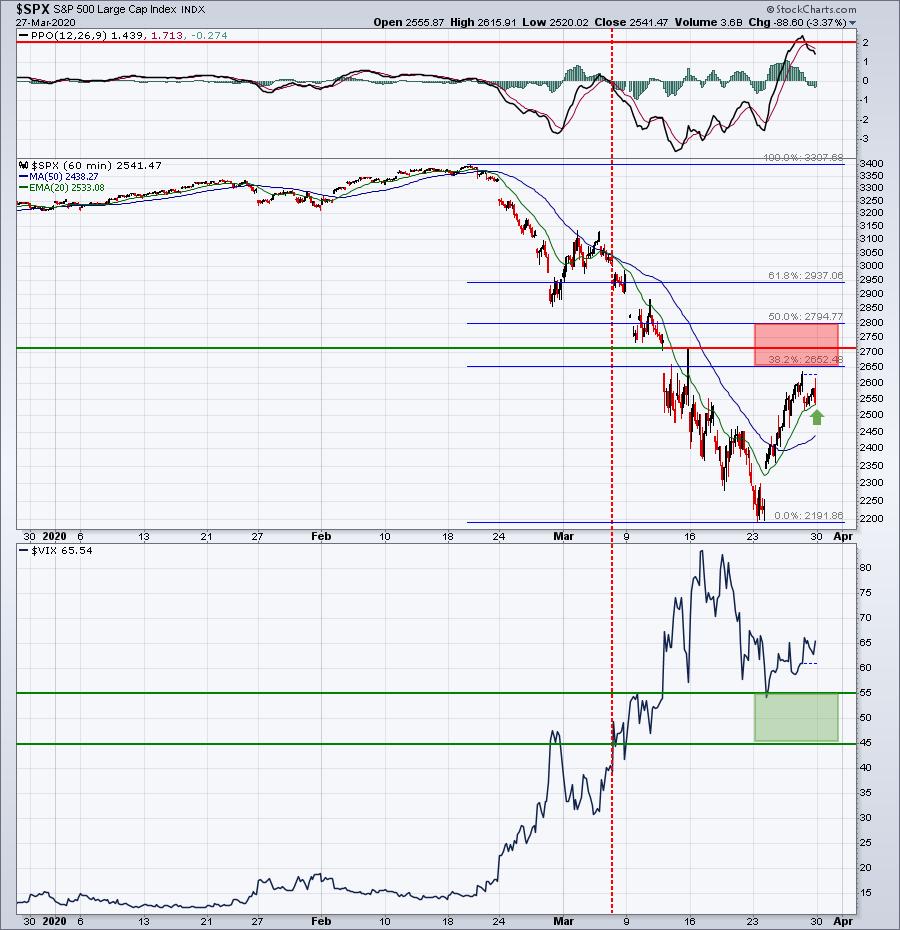
The red-shaded area marks very important Fibonacci retracement levels at 38.2% and 50.0% retracement of the recent decline. We never quite made it that high on the rebound - at least not yet. I think it's possible that we could still enter that "red zone," but Friday's late-day selling resulted in the hourly PPO rolling over from a key level at 2. If we take a trip down memory lane, the following hourly chart from 2008 shows that an hourly PPO reading in the 1-2 range can be difficult to negotiate on rebound attempts:

Those four red arrows highlight the failure of the rally when the hourly PPO hit 1 or 2. The combination of hourly PPOs in the 1-2 range, along with key price resistance, ended the initial price rebound in 2008. My guess is that the same area will be difficult to negotiate in 2020.
Pay close attention to key sentiment readings. The VIX will drop below 45 when the insane fear levels finally start to roll over; that will begin to provide us confirming clues of a bottom. Until then, I'd suggest you remain on guard for another possible impulsive bout of selling.
To be clear, I remain bullish longer-term. But I recognize how the stock market works when uncertainty fills the air. I'd be looking to take advantage of additional selling in the weeks ahead.
If you'd like to join our free 3x per week newsletter, CLICK HERE!
Happy trading!
Tom


