I wrote earlier in the week that, whenever the market rallies by 8-9%, it's obvious that some form of bottom has taken place (however fleeting), so I don't want to state the obvious. It is apparent, though, that some of the short-term indicators have finally begun reversing to the upside, which suggests that, for all intents and purposes, this week's low will hold for a while. Let's consider some of them.
Indicators Start to Flash Buy Signals
Chart 1 features a 10-and 20-day MA of the McClellan Volume Oscillator. Rallies typically develop following periods where the 10-day series reverses to the upside from the oversold dashed green horizontal line. However, when it falls even lower below the solid thick green line and then reverses, a more durable bottom tends to form. Note that the indicator re-crossed back above that line today and actually reached a lower level than it did in December 2018.
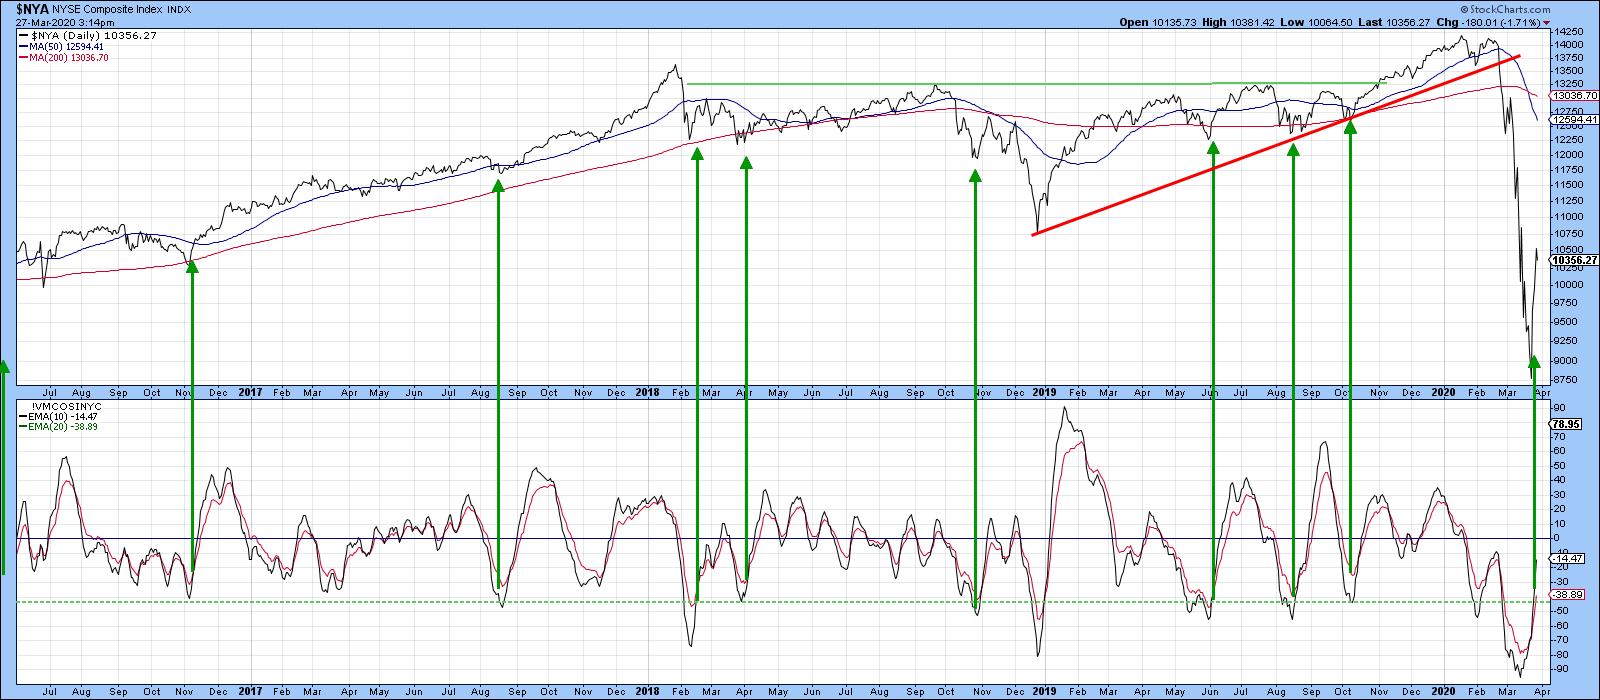
Chart 1
Chart 2 features the NYSE Bullish Percent, which almost took out its 2008 record low, but, at a reading close to 5, certainly reached a crisis extreme. Apart from that October 2008 low (B), it only got really close to the solid line at the bear market bottom in 2009 (C). It also dropped below the dashed line again at A, right at the beginning of the bear market. The fact that this occurred at the start of the bear market gives me pause to think; although a nice rally, taking the Index back to its 200-day MA, followed, it developed close to the peak, which cannot be ruled out in the current situation. It's also interesting that, by Friday, this series had rallied back to the 50 level. That's a bit too fast for my liking.
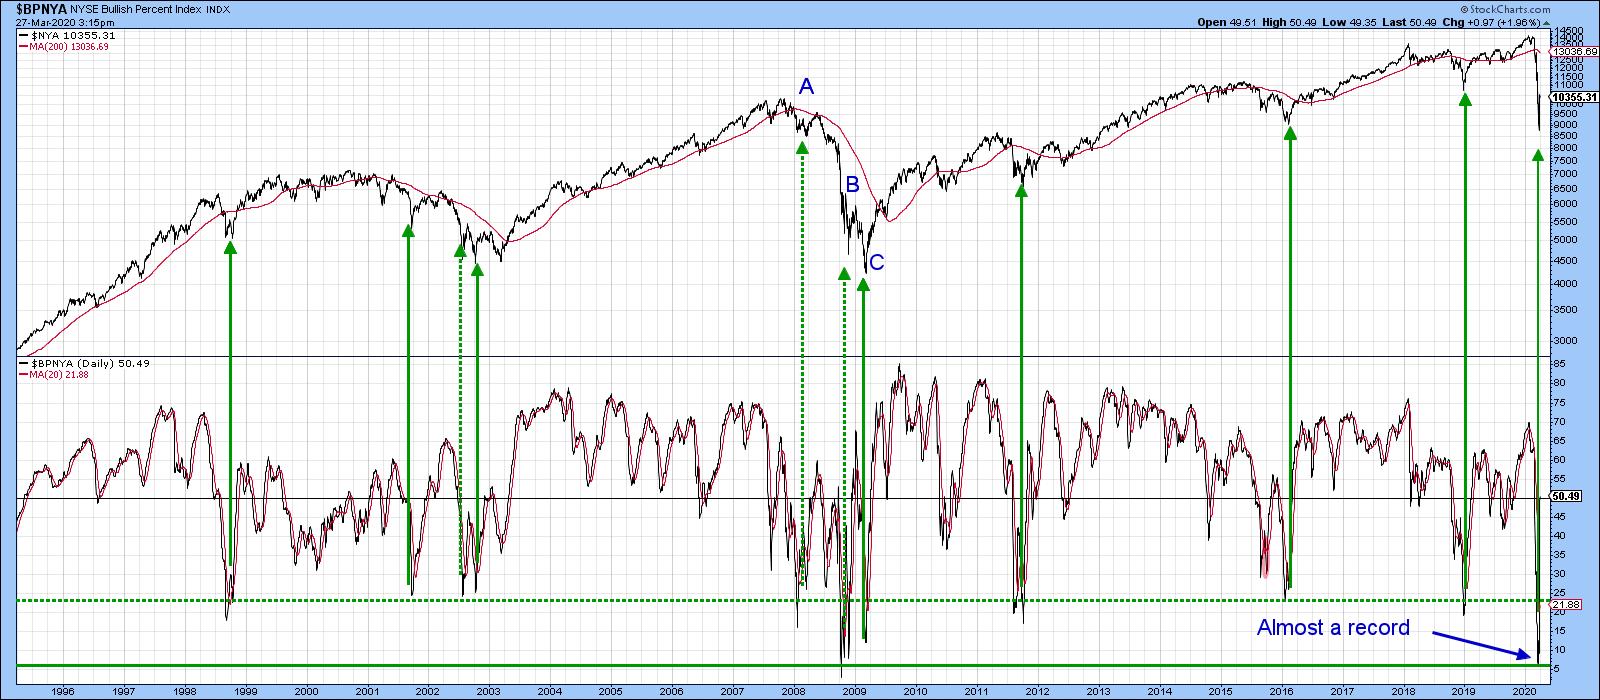
Chart 2
Chart 3 compares the SPDR Dow Jones ETF, the DIA, to my Dow Diffusion indicator. It's a series which monitors the percentage of Dow stocks in a positive trend and triggers buy signals when it reverses direction from an oversold reading. The arrows demonstrate signals that were triggered from an even lower level at the green dashed line. The two dashed arrows reflect weak rallies that developed under the context of the 2007-09 bear market. Even then, the reversals did flag a respite of several weeks from the strong down draft. The indicator's recent level was pretty close to a record, so it's certainly reflecting a deeply oversold market. It's still declining, but has started to flatten. I am expecting a reversal any day now.
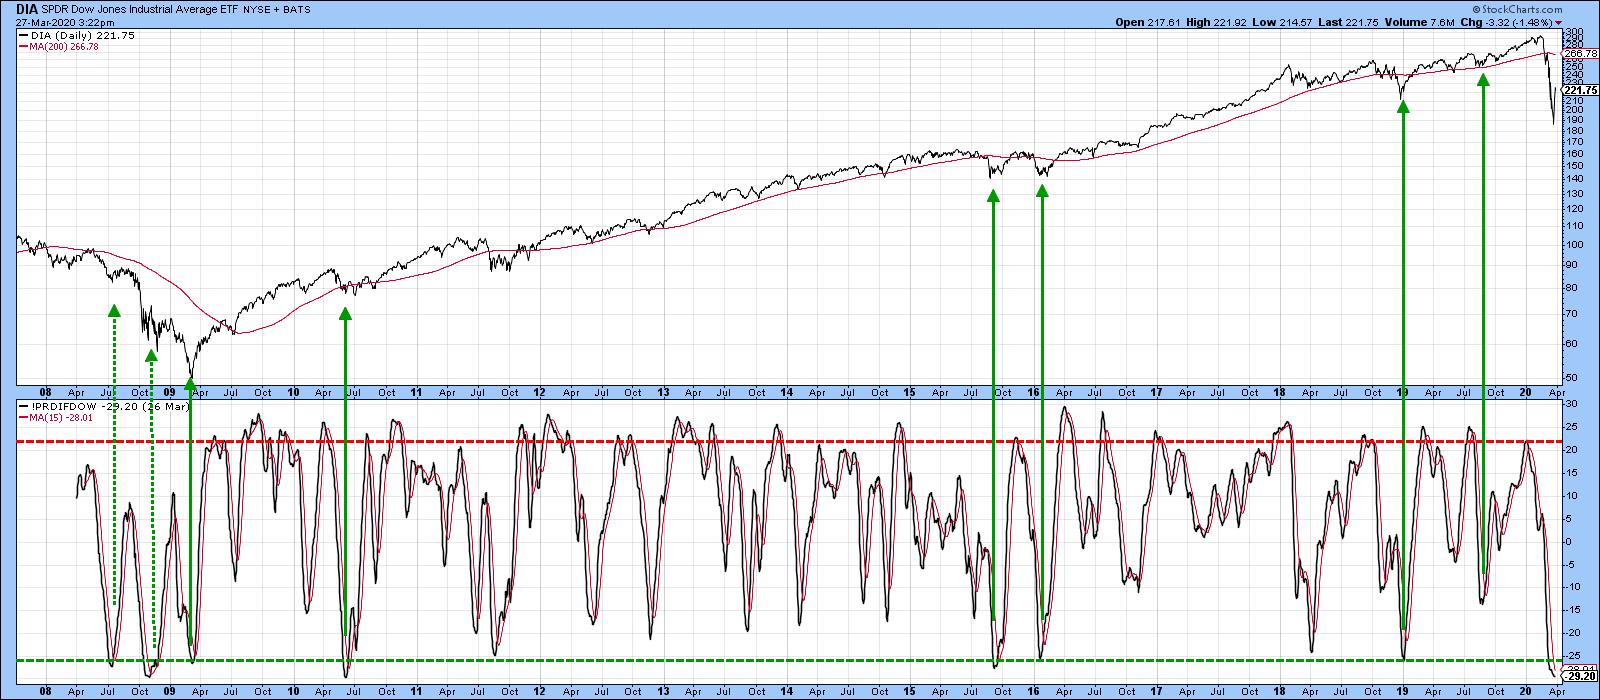
Chart 3
One sign of an improving technical position comes when the Index being monitored falls to a new low for the move, but the number of stocks does not. That's the sort of thing that developed at the 2009 bottom and appears to be materializing today. In Chart 4, it is evident the net number of new lows was far less on Monday's closing than it was on March 12. The NYA closed around 1000 on March 12, yet on Monday it was around 8750.
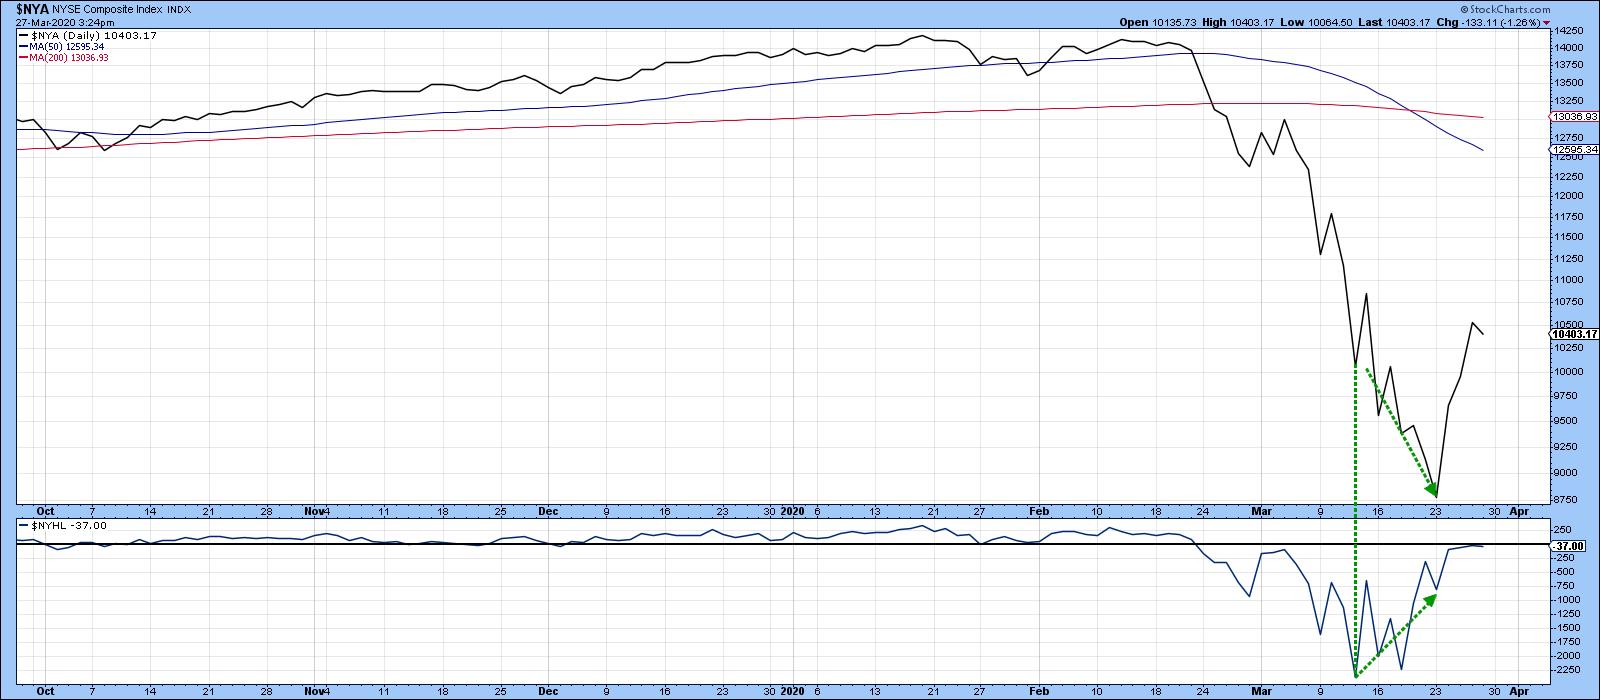
Chart 4
Finally, my Bottom Fisher (!PRBFISH) has actually fallen below its previous record low, set during the 2007-09 bear market. Historical bottoms that have developed at an extreme reading have been flagged by the vertical lines. Seven of them were followed by excellent rallies. Two of them, indicated by the dashed lines, were not so prescient, as they developed during a vicious bear market. Thursday's action resulted in a reversal, but not a MA crossover. Since it was right at the MA, a crossover is likely at any time.
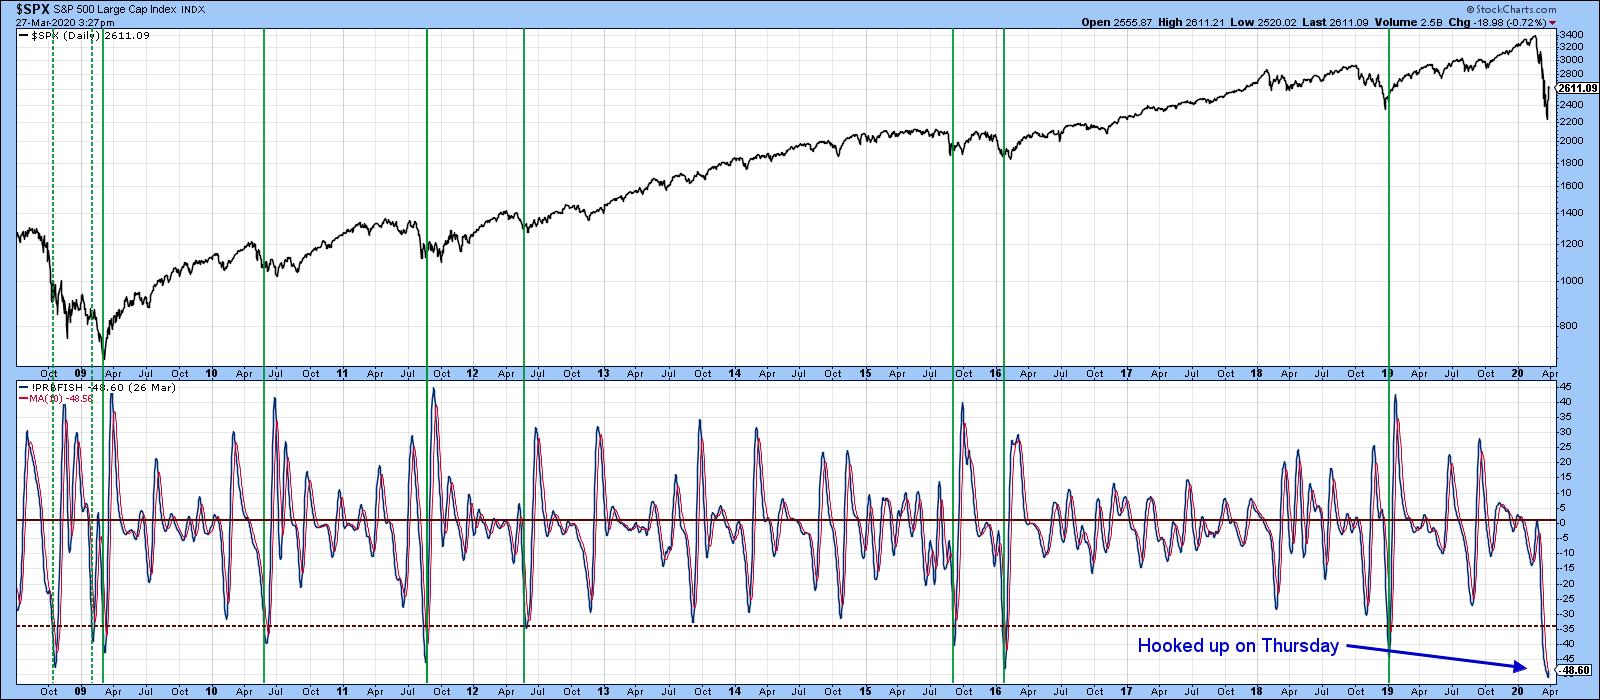
Chart 5
Editor's Note: This is an excerpt of an article that was originally published in Martin Pring's Market Roundup on Tuesday, March 24th at 7:55pm ET, and was later updated and expanded on Friday, March 27th. Click here to read the full article, which includes Charts 6-8 and a discussion of the Great Depression and long-term perspectives.
Good luck and good charting,
Martin J. Pring
The views expressed in this article are those of the author and do not necessarily reflect the position or opinion of Pring Turner Capital Group of Walnut Creek or its affiliates.


