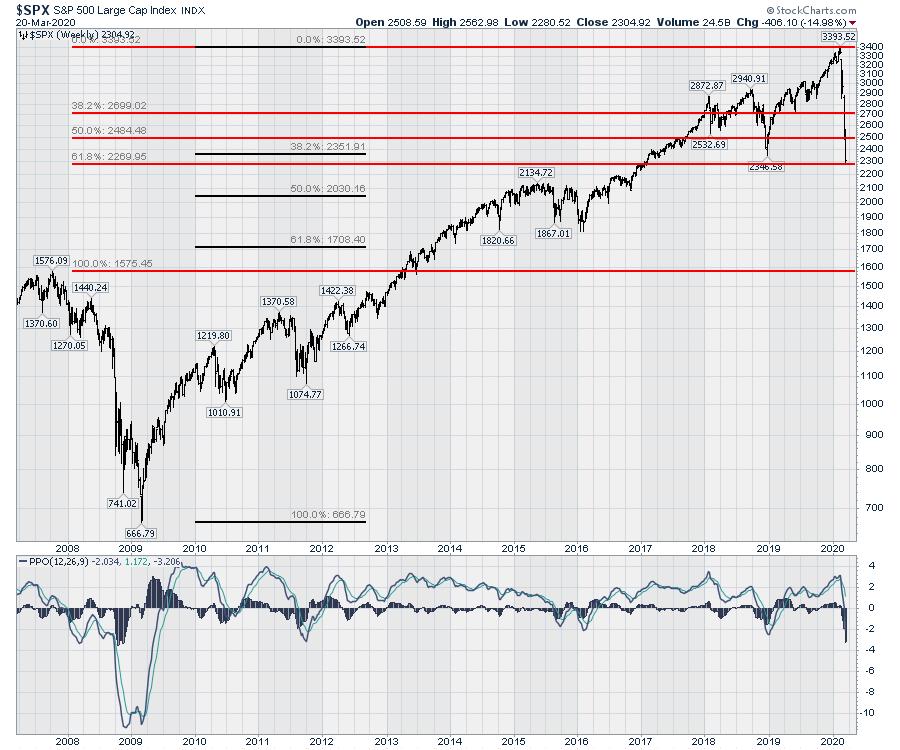
We have now been in the downtrend for one month. The January 19th intraday high (3393) on the SPX is in the books for a little bit as the high, much like 1576 was from 2009. With this week's low, we have moved down to a 50% retracement from the gains after breaking above 2007. That can be seen using the red fibonacci retracement lines.
The black fibonacci retracement lines show we dipped a little lower than the 38% retracement measuring from the 2009 lows.
There are some other interesting facts about the moves we are experiencing.
Some stats:
- The swing in the SPX today between 11am to 1pm was 100 points.
- The range (from high to low) of the day was 158 points.
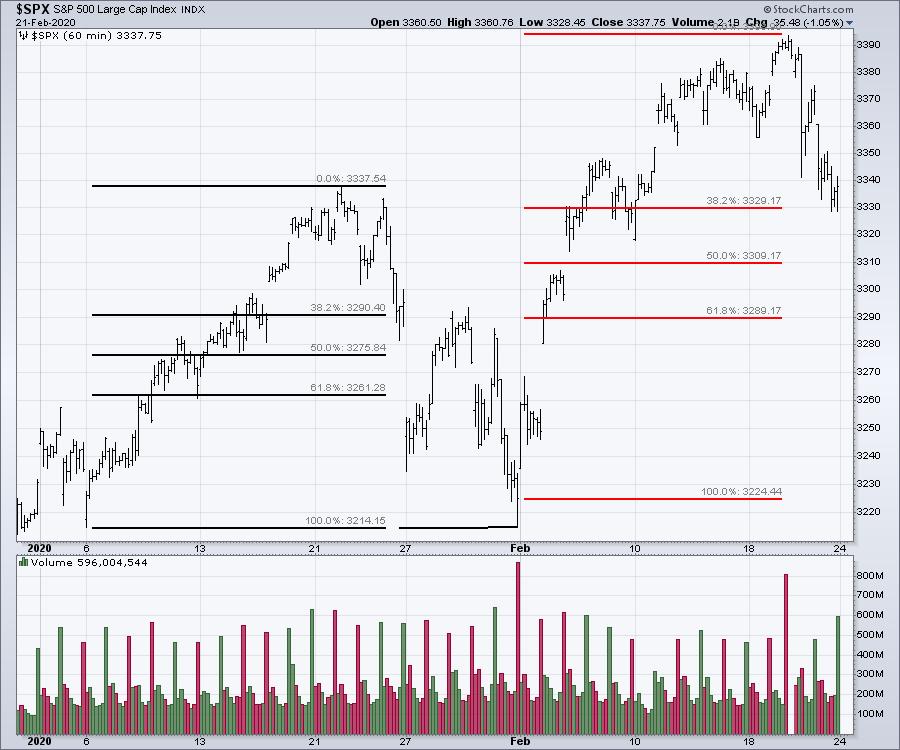
- In comparison, the big up month of January had a total range of 123 points on the S&P 500.
- February rallied hard for a total of 168 points from the close of January to the February high.
For the road down:
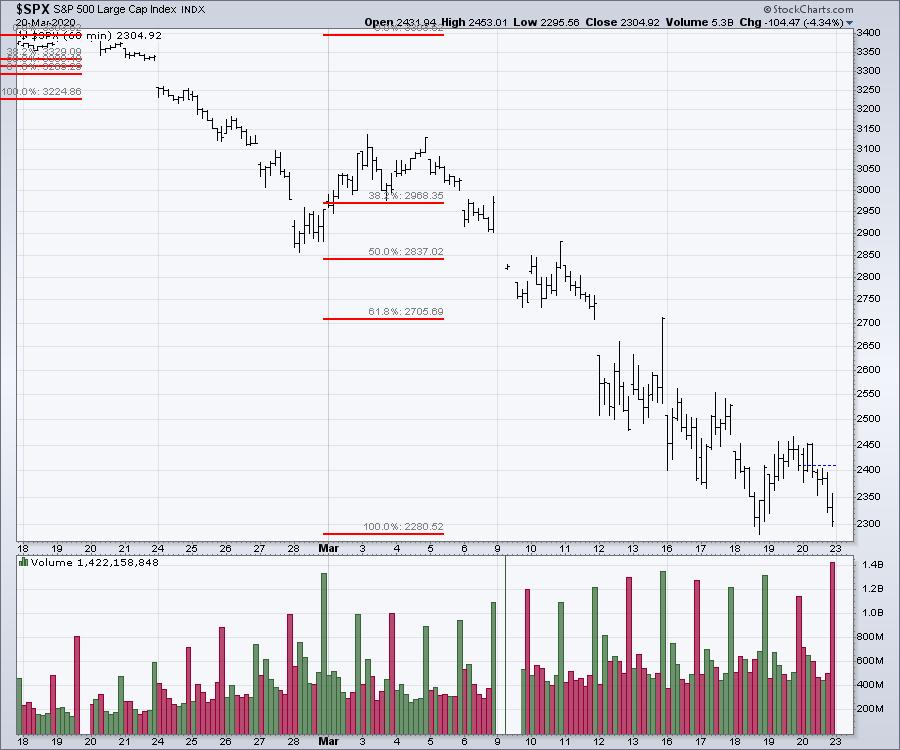
- The total range from the high in February to the end of the month the decline was 532 points.
- In March, down 581 so far.
- Down 1113 points in total.
Some stats for this week:
- The range for the SPX yesterday was 146 points and yesterday was a "calm" day relative to the rest of the week.
- The intraday range for Wednesday was 170 or more than the upthrust in the first three weeks of February.
- The swing from Wednesday's high to Thursdays low was 270.
- The swing from the Friday, March 13th closing high to Monday's low was 330 points.
The entire month of January was -6 points from Dec 31, 2019 close to the January 31, 2020 close. Again, the total January range was 125 points.
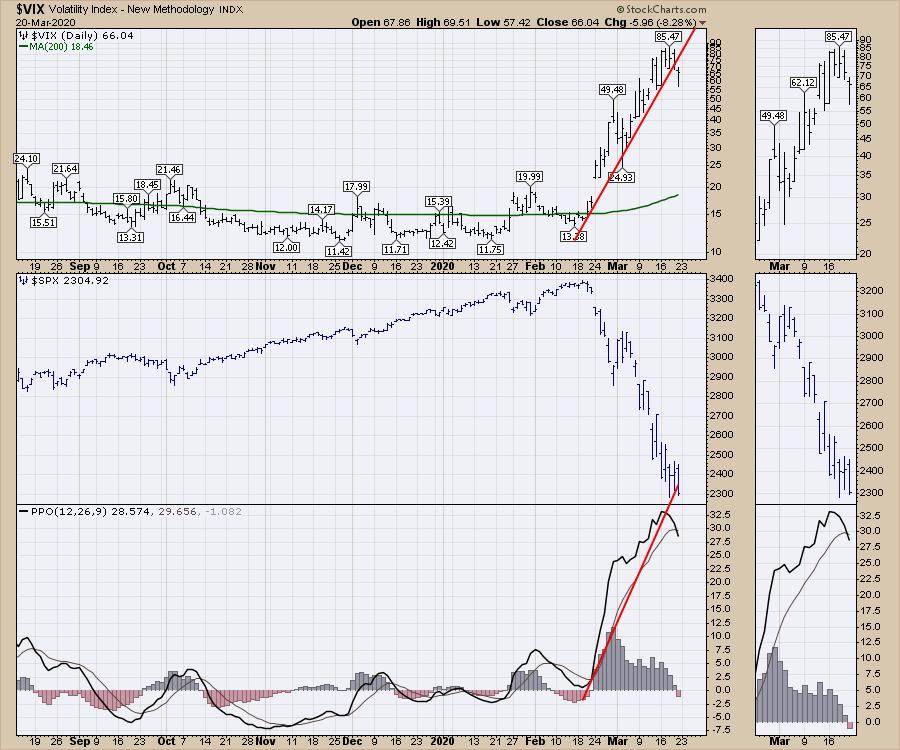
All that to say, the volatility will shake your core. Below is the $VIX with the pinnacle at 85. That rarely lasts. It does not mean the market will go up as the $VIX falls, but you might get a bear market rally. Even though the $VIX moved Dow from 85 to the high 50s today, we didn't even take out yesterday's high.
For more ideas about this market, I would encourage you to watch the Market Buzz video series.
4 Stops Is Not A Start
Stay cautious!
Good trading,
Greg Schnell, CMT, MFTA
Senior Technical Analyst, StockCharts.com
Author, Stock Charts For Dummies
Want to stay on top of the market's latest intermarket signals?
– Follow @SchnellInvestor on Twitter
– Connect with Greg on LinkedIn
– Subscribe to The Canadian Technician
– Email at info@gregschnell.com


