I'm so excited to report sentiment to you this weekend with commentary added from Mark Young of WallStreetSentiment.com. We are seeing extraordinarily high bearish sentiment on most of our charts; however, I don't think we are bearish enough based on extremes we've previously seen.
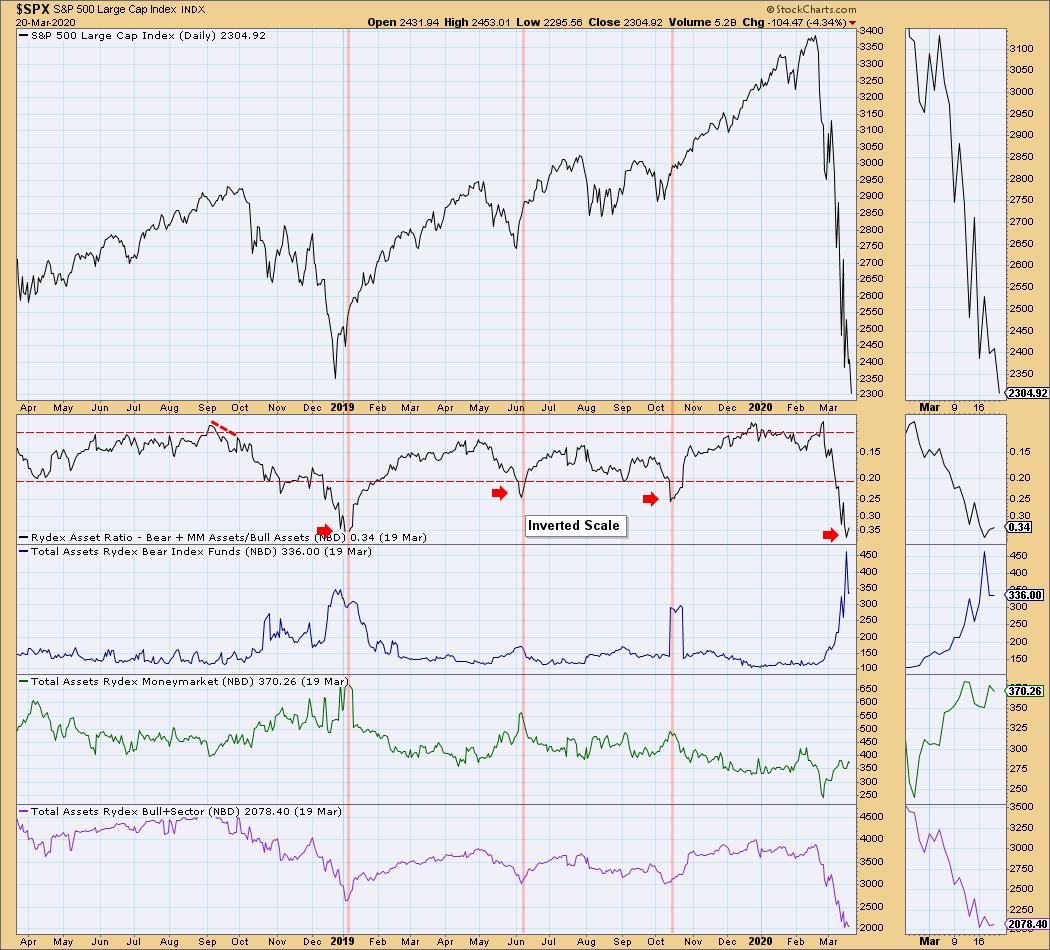
Let's start with the Rydex Ratio chart, which is an exclusive DecisionPoint indicator. We measure the assets in bull and sector funds in comparison to the assets of the bear funds and money market funds. The ratio has hit levels we have not seen since the 2018 low, so it does imply we could see a reversal once the ratio begins to form a strong bottom.

As investors, we want to accomplish two basic things: (1) determine the trend and condition of the market and (2) select stocks that will ride that tide. The DecisionPoint Alert helps with the first step; DecisionPoint Diamonds helps with the second. Go to DecisionPoint.com and SUBSCRIBE TODAY!
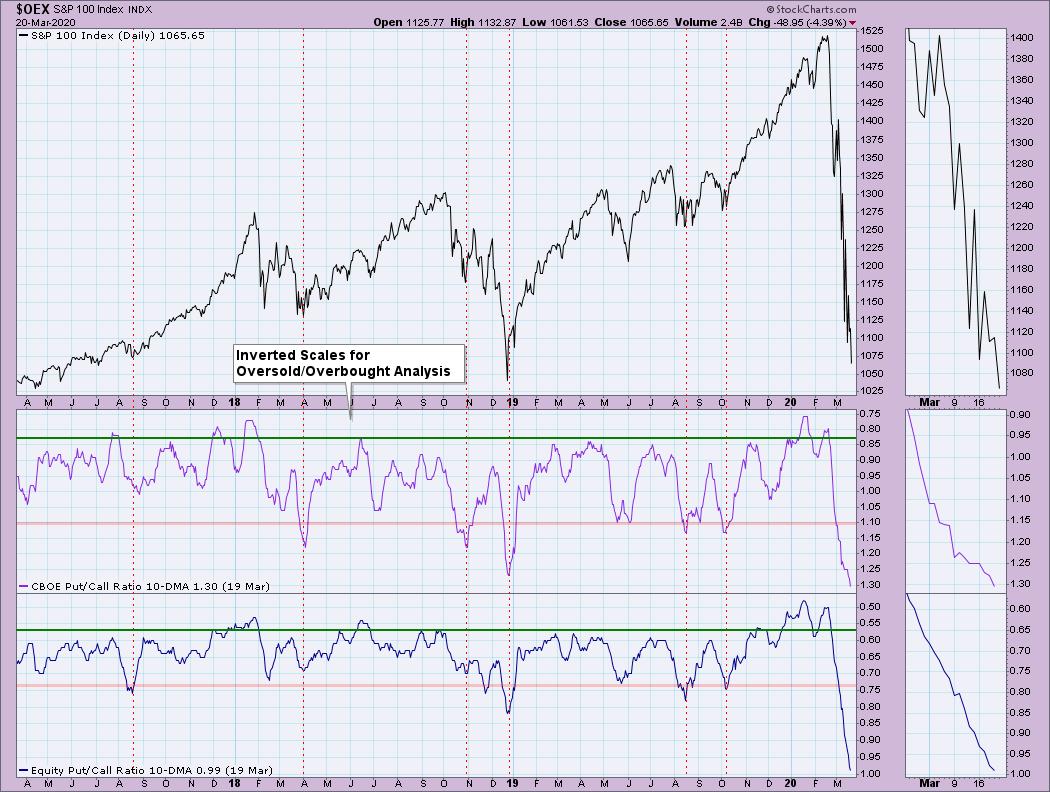
The put/call ratios are very stretched out into oversold territory. We aren't seeing them turn up yet, but when they do, that could signal a true bear market bottom.
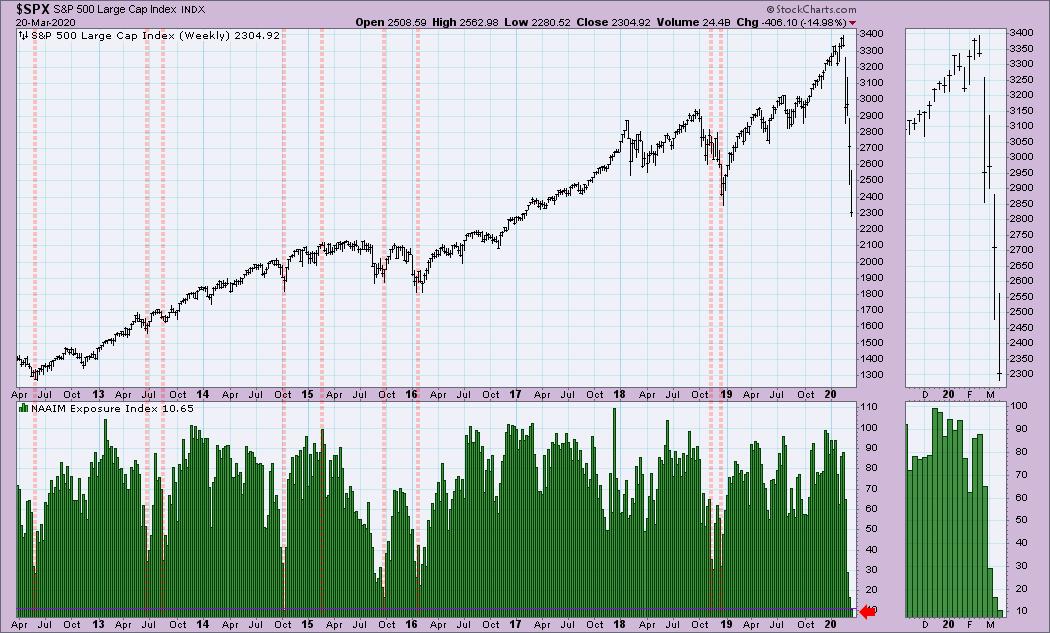
The exposure levels of the Association of Active Investment Managers are very low. We are reaching levels that could point to a market bottom soon.
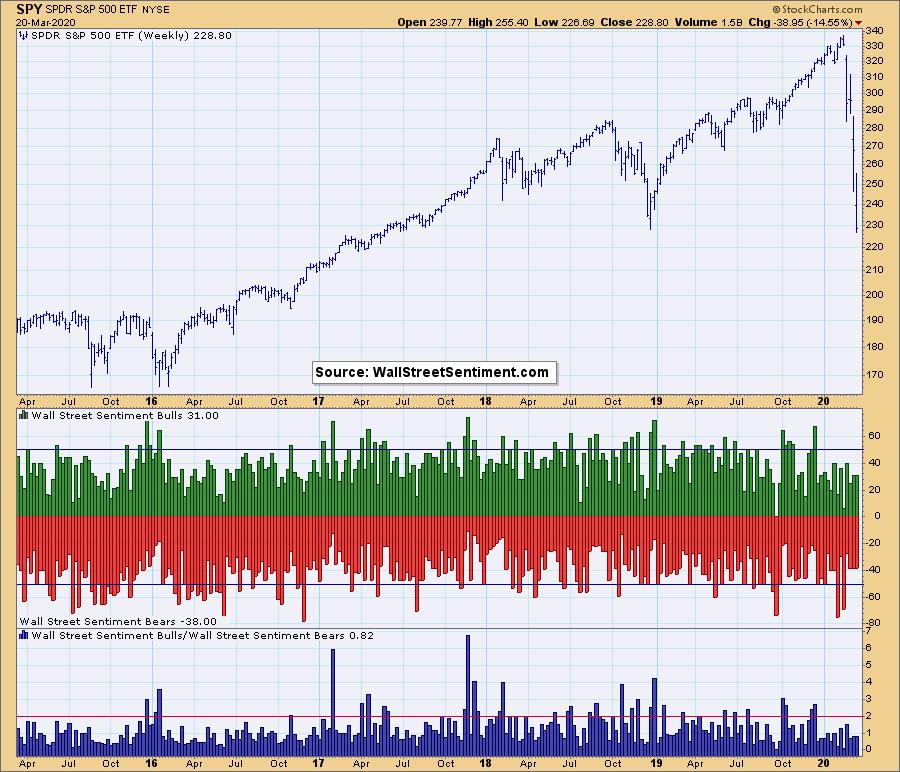
Here are Mark Young's comments on his Wall Street Sentiment Survey results:
"Last week, the Wall Street Sentiment Surveyees were just slightly Bearish at 38% Bears and 31% Bulls. That was mildly Bearish near-term. Of greater interest is the reading 5 bars ago, when Bears were a 69% and Bulls were at just 6%. This was right before the current Bear hit. We have often noted that this crew is very often right (80% of the time since 2015) when there is a strong plurality of Bears, and, in fact, this crew is generally more likely to be right on the course of the market than wrong, most times. We don't have this week's data yet (it will be posted Sunday night here: http://schrts.co/iYEKbnCX ), but bottom pickers will want to see either a lot of Bulls (which is Bullish) or a dead even split (correlated with turning points)."
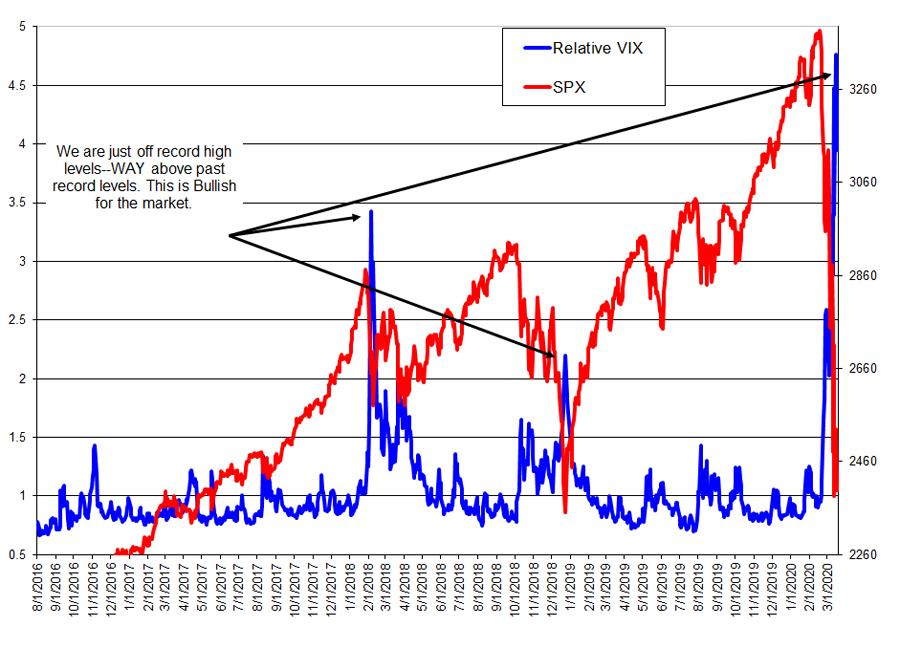
Here are his comments on his VIX chart. I agree with him that readings are certainly very bearish as far as sentiment and, as he said, that is generally bullish for the market. The heartburn is that, with numbers this high, we can't count on them as signals for a bullish reversal.
"The ugliness of the recent decline has generated considerable bullish intermediate-term sentiment for the market. Most notable is the Relative VIX at record high levels. This indicator is a gold standard bottom spotter, measuring deviations of implied volatility (options premiums) vs. the norm - in my view, a high Relative VIX represents 'incentive' for a rally. Premiums are so high now that a large buyer might amply improve his returns by shorting puts or the VIX itself and launch a significant buy program. Stranger things have happened. I can only view such high readings from this indicator as Bullish."
I love Mark's next chart. It's a very ingenious measure of sentiment! Here are his comments:
"Another indicator of excessive Bearishness is accumulated net new shorting via the SH (the ProShares inverse S&P 500 ETF). If there is excess demand for this ETF, rather than allow it to trade at a premium, sponsors will issue more shares. We measure this share issuance. The SH reported $161MM in new shorting on Thursday. Over the past 7 days, there has been $467MM in net new shorting and over the last 21-days there has been $647MM in net new shorting. This is very high all around and a very solid Buy. This is at levels that supported substantial, multi-week rallies in the past."

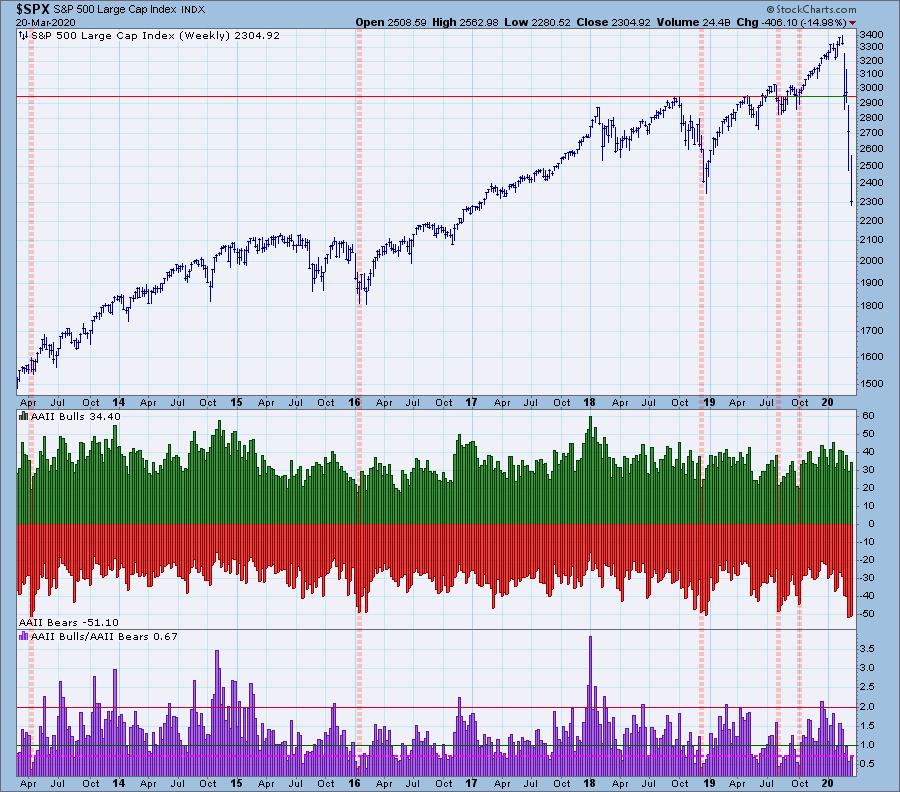
Finally, let's take a look at the American Association of Individual Investors' Poll. I believe we are NOT seeing enough bearish activity here to imply a bear market low. You can see the ratio, while oversold, is not as low as we have seen it. Here are Mark's comments:
"Overall these indicators suggest that a large rally is looming near-term. The one fly in the ointment is the AAII Sentiment. Despite the alarming weakness in global markets, AAII Bulls actually rose to 34.4%, taking this indicator out of Buy territory. That isn't what we would like to see. On the other hand, the AAII pollees have often gotten as Bullish as this or more so right off the low, so this reading is not enough by itself to preclude a good rally. It does, however, imply to me that we may have more weakness after a good bounce."
Conclusion: I hope you enjoyed this "dual" sentiment report! Mark and I are working on putting together a regular sentiment report that we can offer to our subscribers. I'll keep you posted! Overall, we are seeing the bearish oversold readings we want, but, as we keep saying, "This bear market is different." With so much still unknown on the effects of the coronavirus on our economy in the intermediate term, I don't expect to see this bear market reverse.
Technical Analysis is a windsock, not a crystal ball.
Happy Charting! - Erin
Email: erin@decisionpoint.com

If the coronavirus permits, Erin Swenlin will be presenting at the The MoneyShow Las Vegas May 11-13, 2020! You'll have an opportunity to meet Erin and discuss the latest DecisionPoint news and Diamond Scans. Claim your FREE pass here! You can watch online with this pass too!!
Helpful DecisionPoint Links (Can Be Found on DecisionPoint.com Links Page):
DecisionPoint Shared ChartList and DecisionPoint Chart Gallery
Price Momentum Oscillator (PMO)
Swenlin Trading Oscillators (STO-B and STO-V)


