This week has seen U.S. administration fiscal proposals, as well as 1.5 trillion dollars in Fed support, aimed at limiting the economic damage from COVID-19. Friday saw a travel ban put into effect, along with a state of emergency. Unfortunately, these actions, just like the previous week's cut in short-term rates, have so far failed to spur the market in any meaningful way. That's because the market abhors uncertainty, and these actions do nothing to remove it. They will certainly help when the virus dissipates, but, until it becomes evident that it has, the uncertainty will prevail.
That big unknown comes from the expanding number of new cases outside of China, especially in Europe and the US. Last week, I referred readers to https://coronavirus.thebaselab.com/, a site that publishes the latest data on new and existing cases. My conclusion at the time was that COVID-19 appeared to be rotating around the world. Focusing on the most active countries, we showed that China and South Korea had peaked. The latest data in Charts 1 and 2 continues to point in that direction, though the total number of new cases outside of China continues to grow, as shown in Chart 3.
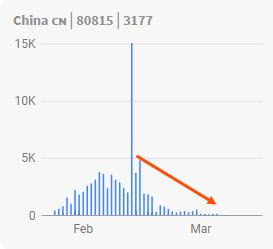
Chart 1

Chart 2 Chart 3
Moving westward, Iran (Chart 4) had been experiencing three down days. That was not sufficient to call a new downtrend, but it was certainly encouraging. This week has seen a bounce back to a marginal new high. No sign of a peak here, unless we see a drop below the previous low. In that case, it would likely signal that Iran had topped out.

Chart 4
So far, Europe has shown no signs of a downside reversal. Problems are concentrated in Italy (Chart 5), where new cases being reported are just shy of 3,000. That compares to Spain and Germany, both around 1,000 each. Obviously, Italy is something to watch closely.

Chart 5
Finally, the US continues to build, albeit from a relatively small number, but it is certainly not showing any signs of peaking. The market is already factoring in the bad news, so when it becomes evident that COVID-19 is in the process of maxing out in Europe or the US, equity prices may snap back pretty quickly. The "may" is in there because it could well involve a two-stage recovery, first from good news in Europe and second from the US. One thing is for sure: sharply lower interest rates and energy prices, combined with fiscal stimulus and Fed liquidity injections, could well convert a sold-out market into a booming one.

Chart 6
Speaking of sold-out markets, Chart 7 shows that the NYSE bullish percentage has almost eclipsed the record set in 2009. The solid green arrows represent previous oversold readings that bounced from the horizontal dashed line, whereas the dashed arrows flag very weak rallies. In either case, the market is buying time - time, perhaps, for those new cases in Europe and the US to peak out.

Chart 7
It seems likely to me that, if China and South Korea can take care of the situation, Europe and the US will soon follow suit. From a contrarian point of view, government action is typically a lagging indicator, as the authorities take their time to respond until the issue in question is on everyone's mind. This week's European travel ban and state of emergency should therefore be viewed as bullish developments.
Editor's Note: This is a duplicate of an article that was originally published in Martin Pring's Market Roundup on Friday, March 13th at 6:04pm ET. Click here to read the original article, which includes live charting capabilities.
Good luck and good charting,
Martin J. Pring
The views expressed in this article are those of the author and do not necessarily reflect the position or opinion of Pring Turner Capital Group of Walnut Creek or its affiliates.


