 The broad market environment is bearish and volatility remains high, even with stock alternatives, such as gold and bonds. This is hardly a conducive environment for trading or investing, but there are alternatives, such as a bear market project. This can be remodeling a room, finally clearing out the garage or preparing for the next bull market through education. With the latter in mind, I created the Essential Breadth Indicator ChartList.
While the price of an index reflects what is happening on the outside, breadth indicators show us what is happening on the inside, and we all know that inside information can provide an edge. Since we are all not Senators, we must use charts to find that edge.
Breadth indicators are also referred to as market internals. As the "vital signs" for an index or sector, breadth indicators reflect aggregate performance for the individual components. As such, breadth indicators can provide leading signals by strengthening before a bottom or weakening ahead of a top. After all, the whole is only as good as the sum of the parts.
A bull market needs leaders and stocks making 52-week highs are leaders. Not every stock needs to hit a 52-week high to support a bull market, but a certain percentage is required to validate upside leadership.
High-Low Percent is calculated just like Advance-Decline Percent: new 52-week highs less new 52-week lows divided by total issues. The indicator is positive when new highs are greater than new lows and negative otherwise. The chart below shows new highs and lows in the middle window and High-Low Percent in the lower window.
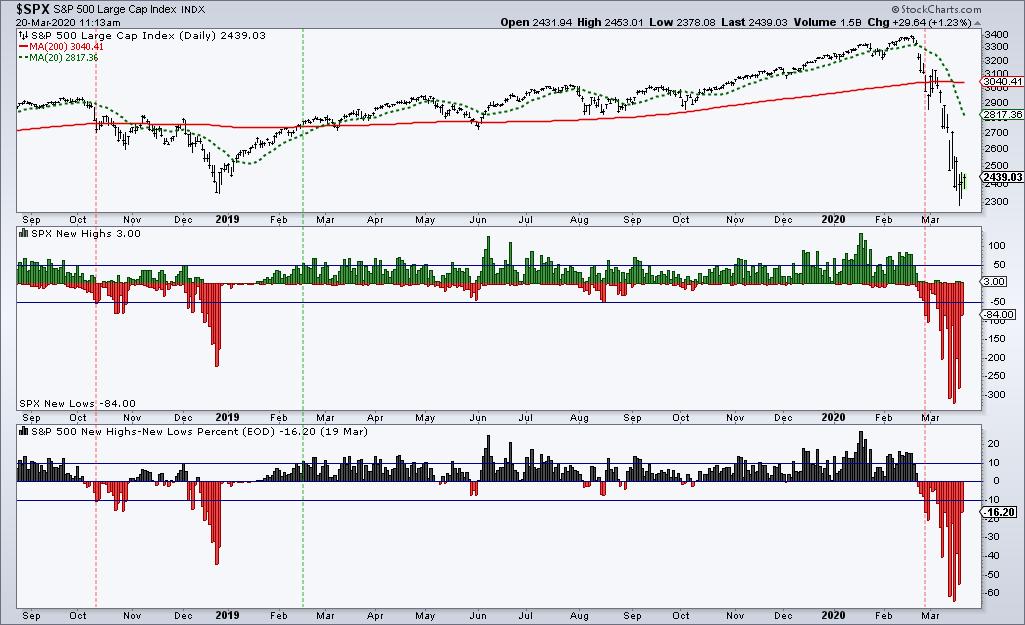
I consider High-Low Percent bullish when it exceeds +10%. This suggests that enough stocks are recording new highs to support a bull market. Even though this indicator can dip into negative territory after a bullish signal, it does not turn bearish until there is a move below -10%. Such a move means new lows have expanded enough to justify a bear market environment.
As the chart above shows, this indicator trigger bearish on 11-Oct-2018, bullish on 15-Feb-2019 and bearish on 27-Feb-2020. The indicator continued lower here in March and clearly has some value when it comes to timing the broader market.
The chart above and more than 100 others are included in Essential Breadth Indicator ChartList, which is available to TrendInvestorPro subscribers. There are customized breadth charts for the S&P 500, S&P MidCap 400, S&P SmallCap 600, Nasdaq 100, 11 Sector SPDRs and Gold Miners ETF. Note that you also need to be a subscriber to StockChart to access the list. There is also a detailed article explaining the signals and settings for the 13 base indicators, and there will be videos next week. Click the link below to see a full list of available charts.
Click here to take your analysis process to the next level!
-------------------------------
Choose a Strategy, Develop a Plan and Follow a Process
Arthur Hill, CMT
Chief Technical Strategist, TrendInvestorPro.com
Author, Define the Trend and Trade the Trend
Want to stay up to date with Arthur's latest market insights?
– Follow @ArthurHill on Twitter
