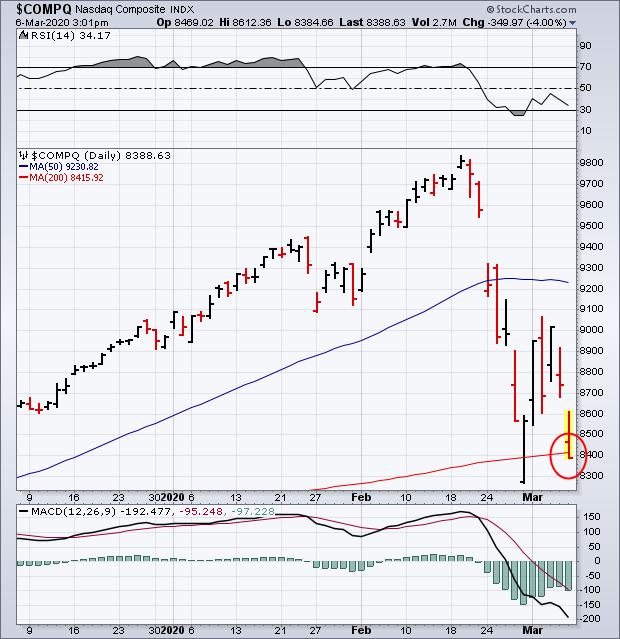
Another day of heavy selling has marked the end of this week's rebound, and a likely retest of last week's lows. Another plunge in bond yields to record lows and a 10% plunge in the price of oil are just two factors contributing to the stock selling. All eleven market sectors are in the red with five of them undercutting last week's low. Small cap indexes are falling to the lowest level since the end of 2018. It looks like an ugly end to a volatile week. Charts 1 and 2 show the Dow and S&P 500 indexes heading back toward last week's lows. Chart 3 shows the Nasdaq Composite in danger of closing below its 200-day average for the first time since last spring. We'll take a more in-depth look at the technical damage being done over the weekend.
Chart 1
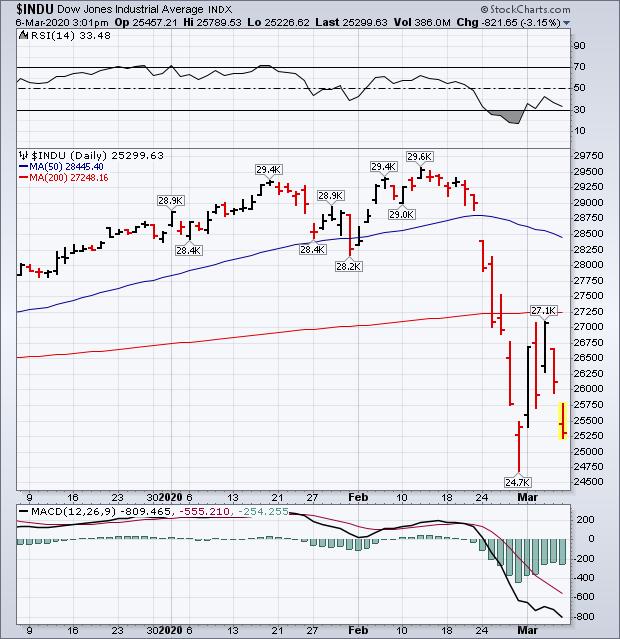
Chart 2
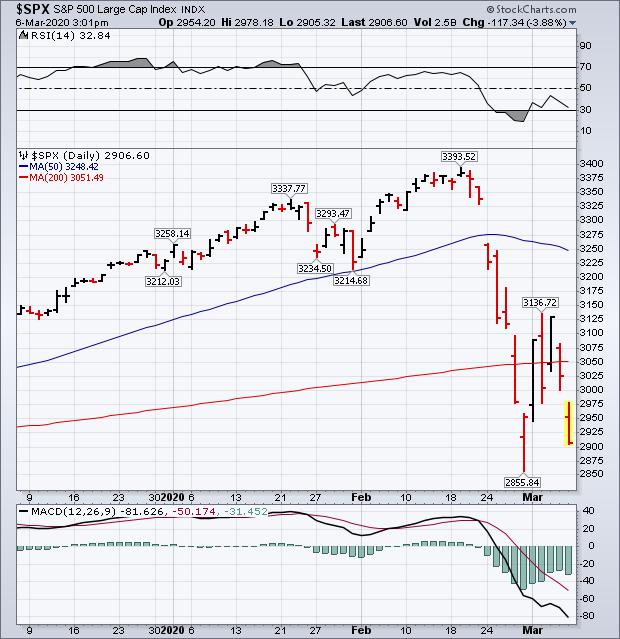
Chart 3
Editor's Note: This is an excerpt of an article that was originally published in John Murphy's Market Message on Friday, March 6th at 3:03pm ET. Click here to read the article in that blog.
