Before I get started, I wanted to let everyone know that DecisionPoint.com "Charter Member" discounts end this weekend! If you've thought about subscribing, now would be the time! You'll find back issues (samples) of the DP Alert and Diamonds from last year in the free DecisionPoint Blog on StockCharts. You can also see an up-to-date sample of the DP Alert from last week: "We Were Warned (Part II)" where I opted to open up our paid commentary to everyone for the day. Hope you'll join us!
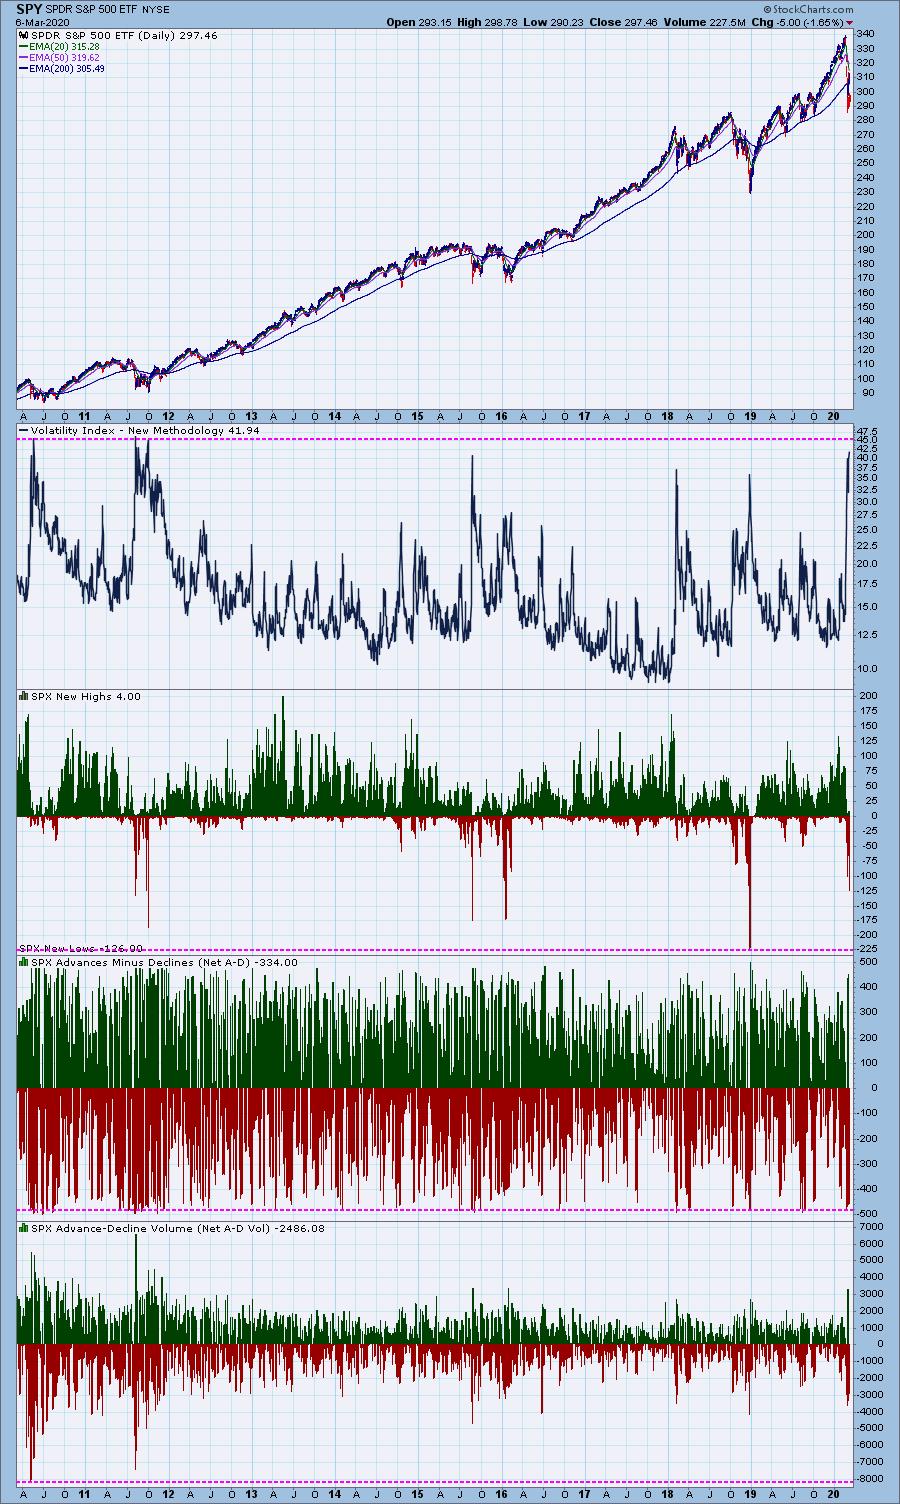
I wanted to check my indicator charts and determine how oversold the market is right now. You would think, after this historically quick correction and likely soon-to-be bear market, that all of our indicators would be completely stretched out and oversold. That isn't quite the case. First, let's look at the VIX and breadth numbers from previous bear market moves. The VIX is near its highest reading for the past 10 years, so that is oversold. Yet New Lows never have reached the depths we saw in 2018. Advances-Declines is oversold and on par. The Advance-Decline Volume, however, has not even come close.

As investors, we want to accomplish two basic things: (1) determine the trend and condition of the market and (2) select stocks that will ride that tide. The DecisionPoint Alert helps with the first step; DecisionPoint Diamonds helps with the second. Go to DecisionPoint.com and SUBSCRIBE TODAY! (Charter Subscriber Discounts DISAPPEAR TODAY!)
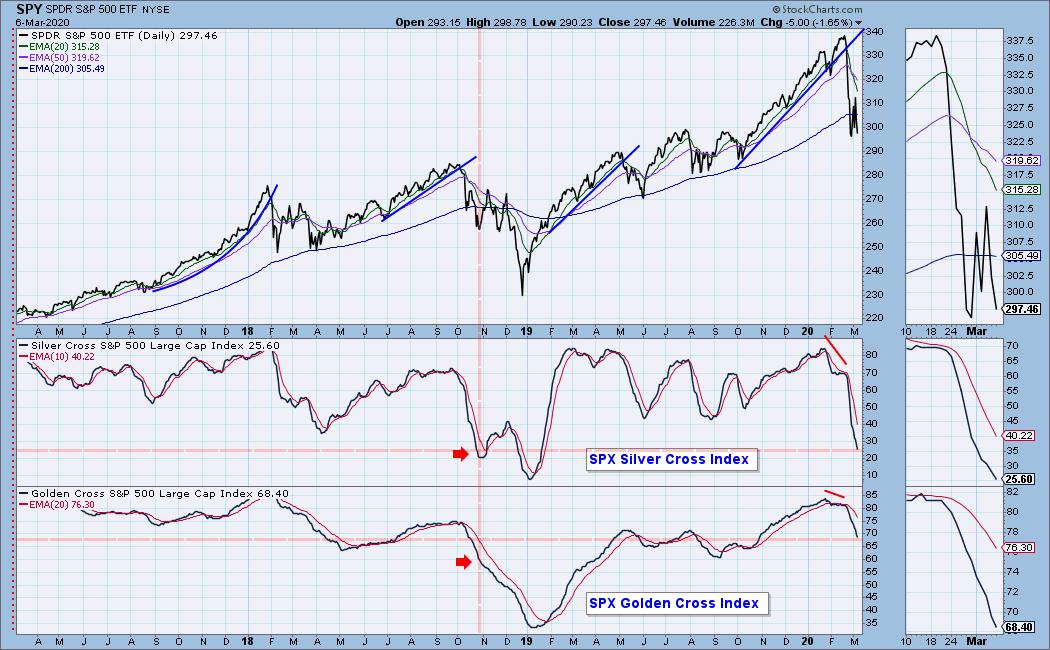
The new DecisionPoint Golden Cross Index and Silver Cross Index are about where they were after the decline in October. We need to see oversold readings like we had at the actual market bottom in December 2018. The Silver Cross Index is very oversold, but not as oversold as it could be. The Golden Cross Index is clearly NOT oversold, as it's barely hitting neutral territory right now.
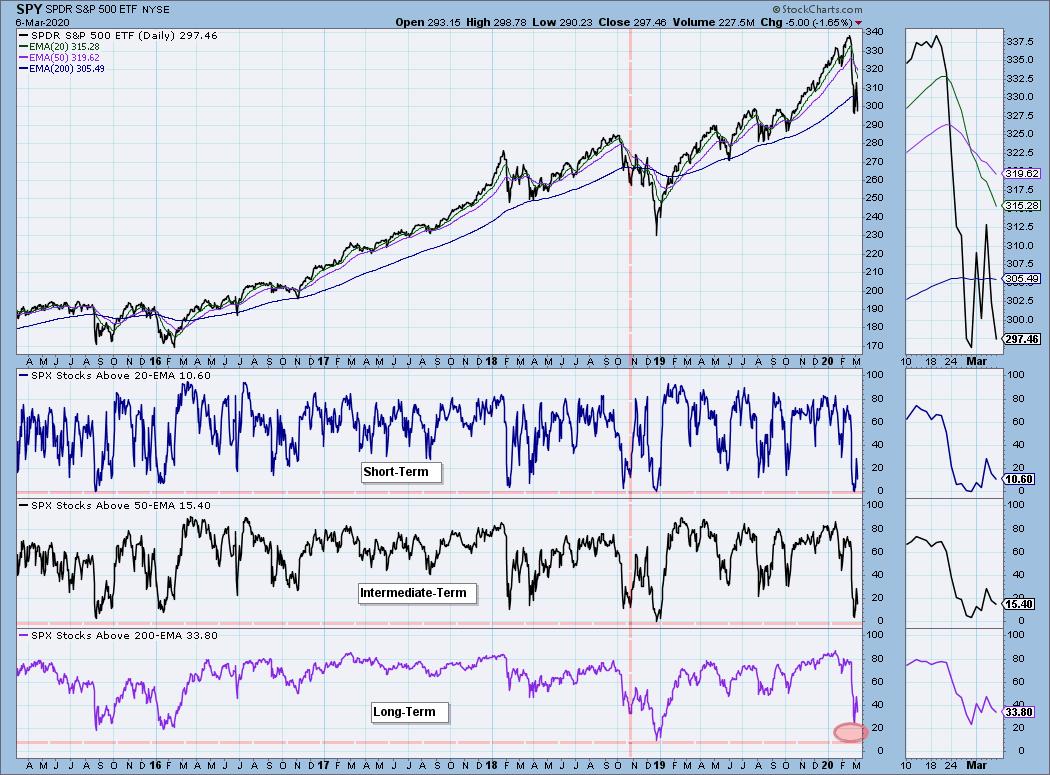
Finally, I'd like to leave you with this chart on %Stock Above Their 20/50/200-EMAs. The short and intermediate term are oversold, but the long term still has ground to cover to move to the same levels as we saw in previous corrections. We also saw a bounce on both the ST and IT indicators, but it didn't result in the end of this correction.
Conclusion: The market is short-term very oversold. The problem lies in the longer-term readings, which are not really oversold enough. Carl and I are looking at this as the start of a bear market. More long-term damage needs to be done to those indicators. DP subscribers: To see more indicator charts, be sure to catch Carl's Weekly Wrap today!
Technical Analysis is a windsock, not a crystal ball.
Happy Charting! - Erin
Email: erin@decisionpoint.com

Erin Swenlin will be presenting at the The MoneyShow Las Vegas May 11-13, 2020! You'll have an opportunity to meet Erin and discuss the latest DecisionPoint news and Diamond Scans. Claim your FREE pass here! You can watch online with this pass too!!
Helpful DecisionPoint Links (Can Be Found on DecisionPoint.com Links Page):
DecisionPoint Shared ChartList and DecisionPoint Chart Gallery
Price Momentum Oscillator (PMO)
Swenlin Trading Oscillators (STO-B and STO-V)
