Today's ChartWatchers article is an updated excerpt from the DecisionPoint Alert Report for subscribers:
I pointed out to my subscribers on Thursday that, with all of the volatility, our short-term indicators seem to be more on point than usual. Below, I've included three indicator charts that I think you will find interesting.
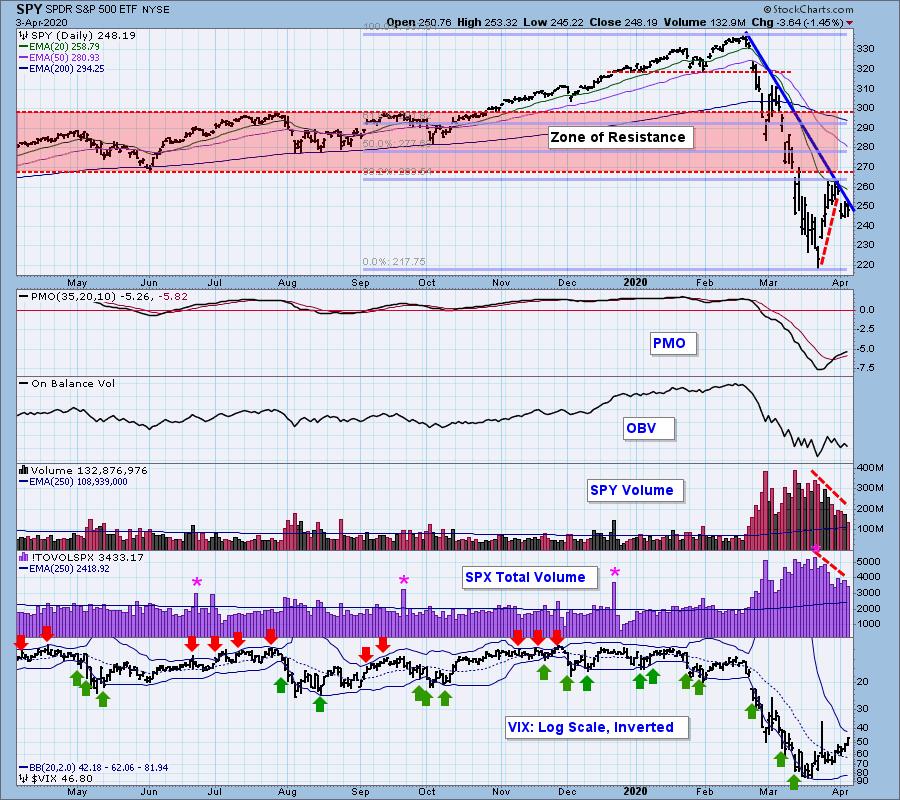
Overhead resistance continues to prove too much for the market. After reaching a strong "zone of resistance," the 20-EMA and the Fibonacci Retracement line, price gapped down. Total volume is moving lower, but is still well-above the annual average. It is bearish to see a decline in volume concurrent with a rising market. The Bollinger Bands on the VIX are beginning to contract, meaning that readings will be hitting the top band soon. That is an overbought condition in a bear market. We will want to watch this carefully.
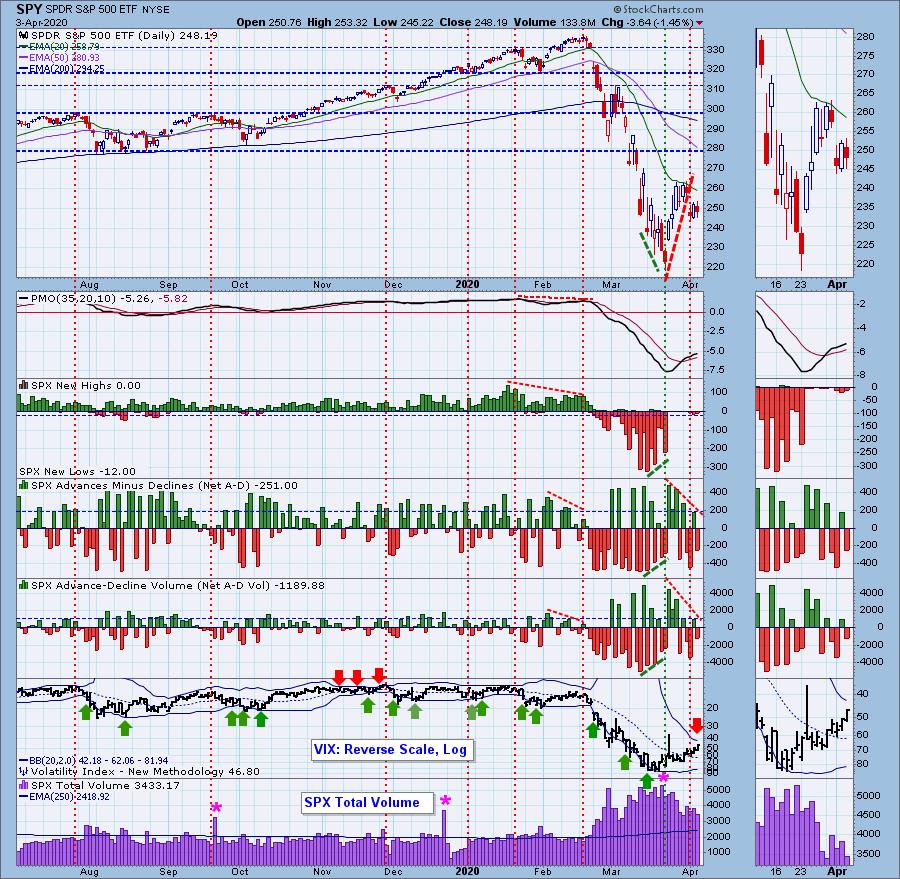
Climactic Market Indicators: Today's ChartWatchers headline implies that, so far, our short-term breadth indicators have been quite helpful. Indeed, they have been. Declining tops in negative divergences with rising tops on price are coming right before downturns. We also saw a positive divergence -- while price was falling, there were rising bottoms on the breadth indicators, which suggested less negativity below the surface. We may be starting to see a contraction on negative readings on the Net A-D bars, which previously was an indicator that a short-term bottom was coming. I need to see a few more days of bearish readings contracting to really identify if the market will find a short-term bottom again. Currently, the decline in positive breadth tells me we aren't out of the woods just yet. The VIX is rising on the inverted scale, but the upper Bollinger Band is close by 42.18.

As investors, we want to accomplish two basic things: (1) Determine the trend and condition of the market, and (2) select stocks that will ride that tide. The DecisionPoint Alert helps with the first step, and DecisionPoint Diamonds helps with the second. Go to DecisionPoint.com and SUBSCRIBE TODAY!
Short-Term Market Indicators: The ST trend is UP and the market condition is NEUTRAL based upon the Swenlin Trading Oscillator (STO) readings. You may question readings being considered "neutral," as the -200 level tends to identify as oversold under normal market conditions. Ah! Key word "normal". We are in a bear market and it won't be unusual to see readings stretching back to the -700 level. Notice how all of these indicators started moving lower despite recent gains for the SPY. Again, very timely turnaround on the the STOs.
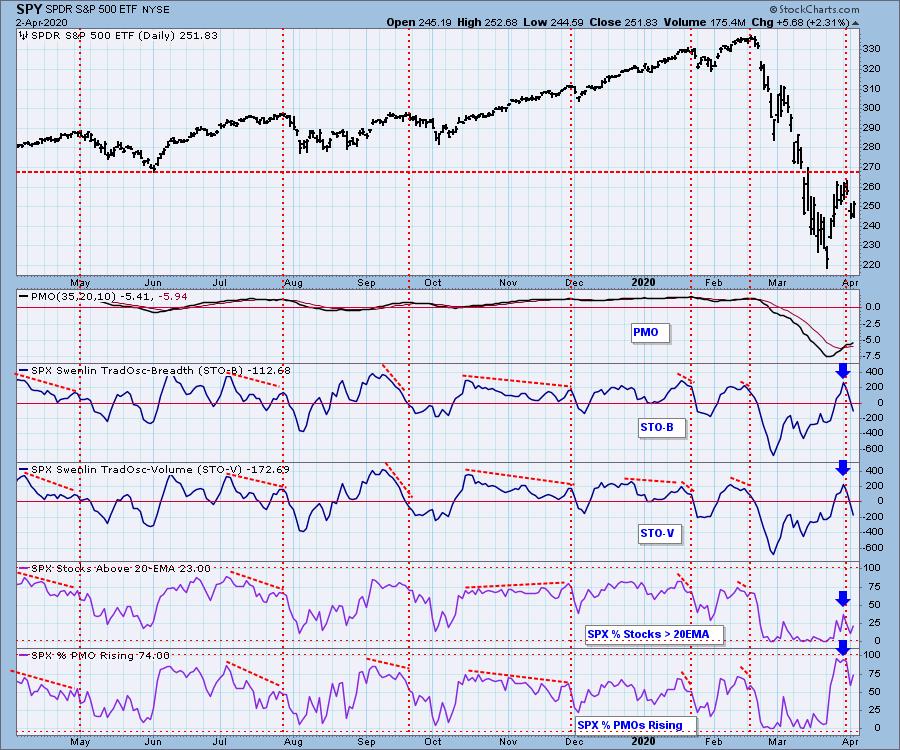
CONCLUSION: Our DecisionPoint Alert subscribers have had the opportunity to see and be on top of all of these indicators throughout this bear market, and they have been nailing tops and bottoms. Given the current condition of these indicators, I would look for another test of bear market lows very soon. When the Swenlin Trading Oscillators begin to turn back up, our readers will be the first to know!
Technical Analysis is a windsock, not a crystal ball.
Happy Charting! - Erin
Email: erin@decisionpoint.com

New dates have been released for The Money Show in Las Vegas! Erin Swenlin will still be presenting at the The MoneyShow Las Vegas August 16-18, 2020 at Bally's & Paris Resorts! You'll have an opportunity to meet Erin and discuss the latest DecisionPoint news and Diamond Scans. Claim your FREE pass here! You can watch online with this pass too!!
Helpful DecisionPoint Links (Can Be Found on DecisionPoint.com "Blogs & Links" Page)
DecisionPoint Shared ChartList and DecisionPoint Chart Gallery
Price Momentum Oscillator (PMO)
Swenlin Trading Oscillators (STO-B and STO-V)


