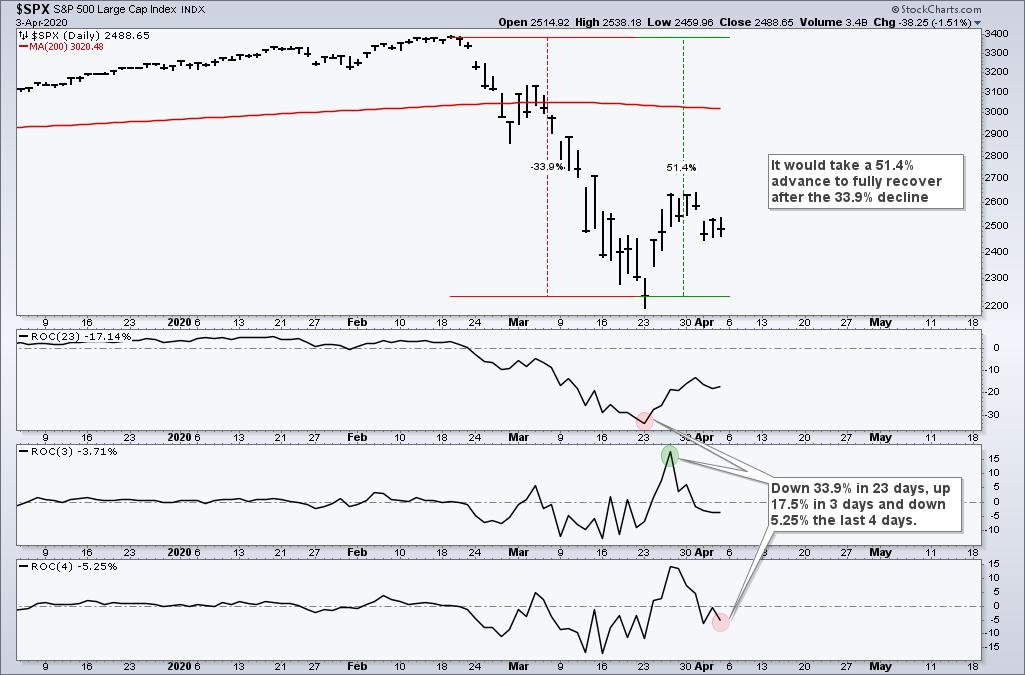
 The S&P 500 went from a historic decline to a historic bounce to an above average drop. This key benchmark fell 33.9% in 23 days, surged 17.55% in three days and then dropped 5.25% the last four days. In fact, the index has experienced nine swings of five percent or more since February 19th. Tis enough to make the Coney Island Cyclone look tame.
Even though the S&P 500 is making a lot of history, it is not making much headway as the index did not even come close to its falling 200-day SMA on the oversold bounce. Clearly, the long-term trend remains down. In case you were wondering, it would take a 51.4% gain to get back to the February highs.
The deeper the decline, the bigger the advance needed to get back to break even. For example, a decline from 100 to 50 would be 50%. It would then take a 100% advance to get back to 100. With stocks often taking the elevator down and the stairs up, getting back to break even often takes a lot more time.
The next chart shows the round trip from October 2007 to August 2012 taking 253 weeks, which is around 59 months and almost 5 years. The S&P 500 fell 56% in 73 weeks and then took another 180 weeks to get it all back. It took more than twice as long to fully recover.
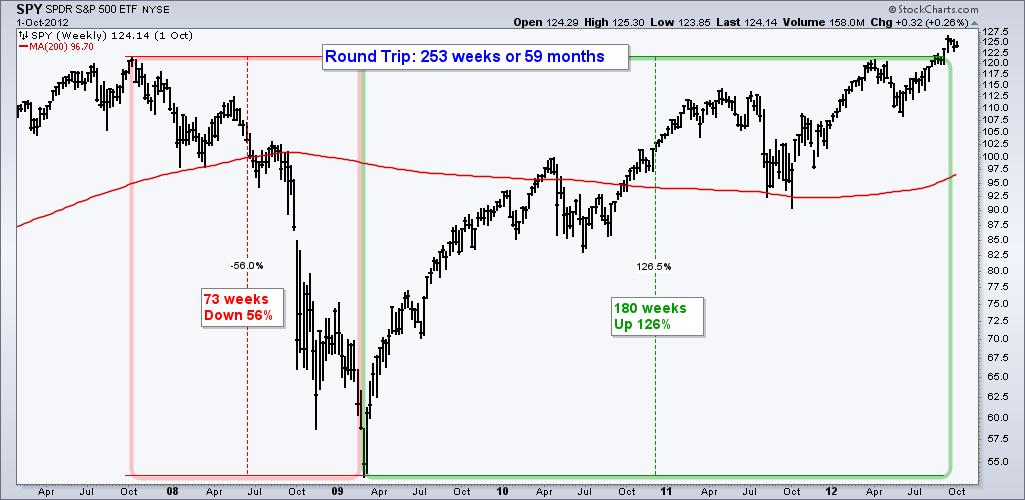
Not all bear markets are the same, but we also saw something similar between 2000 and 2007. There was also a ~50% decline in between and the recovery took twice as long as the decline.
I do not know how long this bear market will last or how deep it will go, but the evidence is currently bearish and investors should plan accordingly. At TrendInvestorPro.com, we take a weight-of-the-evidence approach to broad market timing and will continue to monitor our index and sector breadth models, which turned bearish at the end of February. In addition, the following reports were issued this past week:
- Putting the All-Weather Portfolio through the Wringer
- An Industry ETF and Stocks with Secular Growth Prospects
- Don't Fall for Red Herrings during a Bear Market
Click here to take your analysis process to the next level!
----------------------------------
Choose a Strategy, Develop a Plan and Follow a Process
Arthur Hill, CMT
Chief Technical Strategist, TrendInvestorPro.com
Author, Define the Trend and Trade the Trend
Want to stay up to date with Arthur's latest market insights?
– Follow @ArthurHill on Twitter


