I received an email after trading on Wednesday 5/14 that included a great question about catching mid-day reversals:
"I struggle the most in days like today (5/14) where the market goes one way and then it changes direction. How do you identify when that is happening?
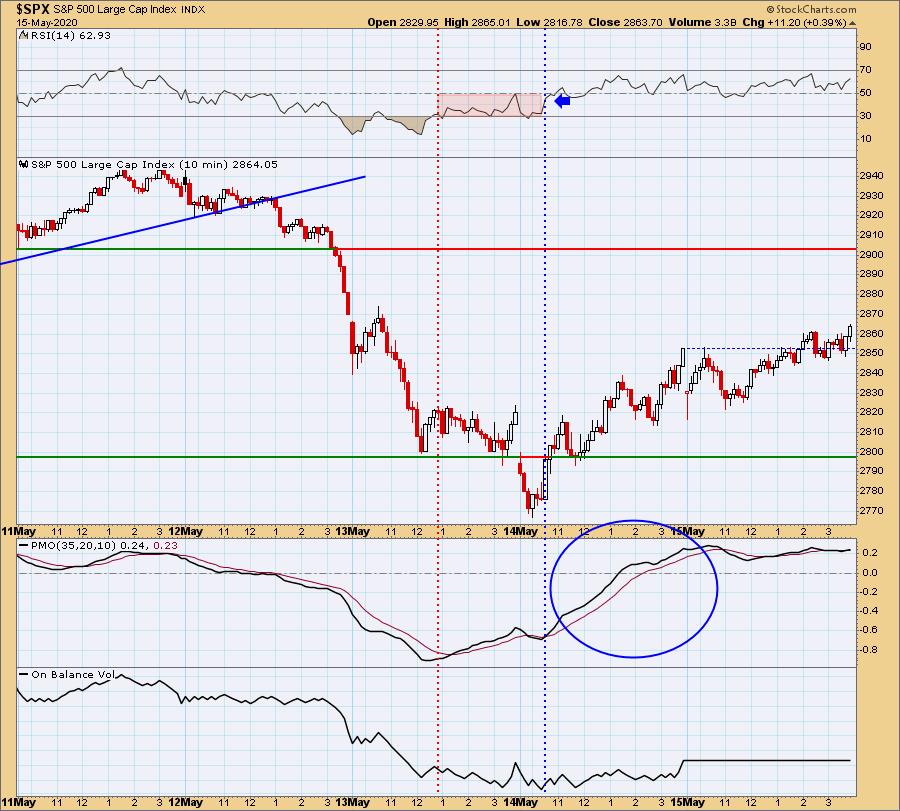
Your best bet is to use an intraday chart. I use a 5-min or 10-min bar chart when I am looking for an entry on a stock I already know I want (if it behaves). You will find that, on an intraday chart, the RSI and PMO are immensely helpful. For the purpose of today's article, I'm going to use a 10-min bar chart, which shows us five days. Let's look at two key points in two of these days. I want to start with yesterday (the dotted blue vertical line). This was a key reversal point for yesterday. Notice how, on the initial push higher, we got a Price Momentum Oscillator (PMO) BUY signal and, shortly after, the RSI moved above net neutral (50). This gave us two important signs that this was likely a key reversal point. As the RSI moved above net neutral, the PMO continued to move higher. There were "pauses" but, ultimately, it remained above its signal line.
Now let's look at the red vertical line from 5/13. Mid-day, a possible key reversal point appeared. However, notice the difference in the configuration of the indicators. The PMO started up, but the RSI was not above net neutral. That rally failed.

As investors, we want to accomplish two basic things: (1) Determine the trend and condition of the market and (2) select stocks that will ride that tide. The DecisionPoint Alert helps with the first step, and DecisionPoint Diamonds helps with the second. Go to DecisionPoint.com and SUBSCRIBE TODAY! (Charter Subscriber Discounts Available!)
Live Trading Room - Tuesdays/Thursdays

DecisionPoint.com Bundle Subscribers Get the
LIVE Trading Room for FREE ($49 Value)! Join Today!
Conclusion: It's important to follow a very short-term chart (5/10/15-minute) and watch the indicators to pinpoint possible key reversal points. Many people don't realize that the PMO can be used on very short-term charts and still provide the important information you need to trade. The RSI is an excellent companion to confirm price action and the PMO.
If you'd like a trial to our website newsletters, contact support@decisionpoint.com and we will hook you up!
Happy Charting! - Erin
Diamond of the Week (from Wednesday 5/13 DP Diamonds Report):
Below are the original article and charts. Underneath each chart, I've included the updated chart for today. If you watched this week's "The Pitch" on StockCharts TV, you saw my commentary on Beyond Meat, Inc (BYND).
Beyond Meat, Inc (BYND) - Earnings: 7/28/2020 (AMC)
Beyond Meat, Inc. engages in the provision of plant-based meats. Its products include ready-to-cook meat, under the brands The Beyond Burger and Beyond Sausage, and frozen meat, namely Beyond Chicken Strips and Beyond Beef Crumbles.
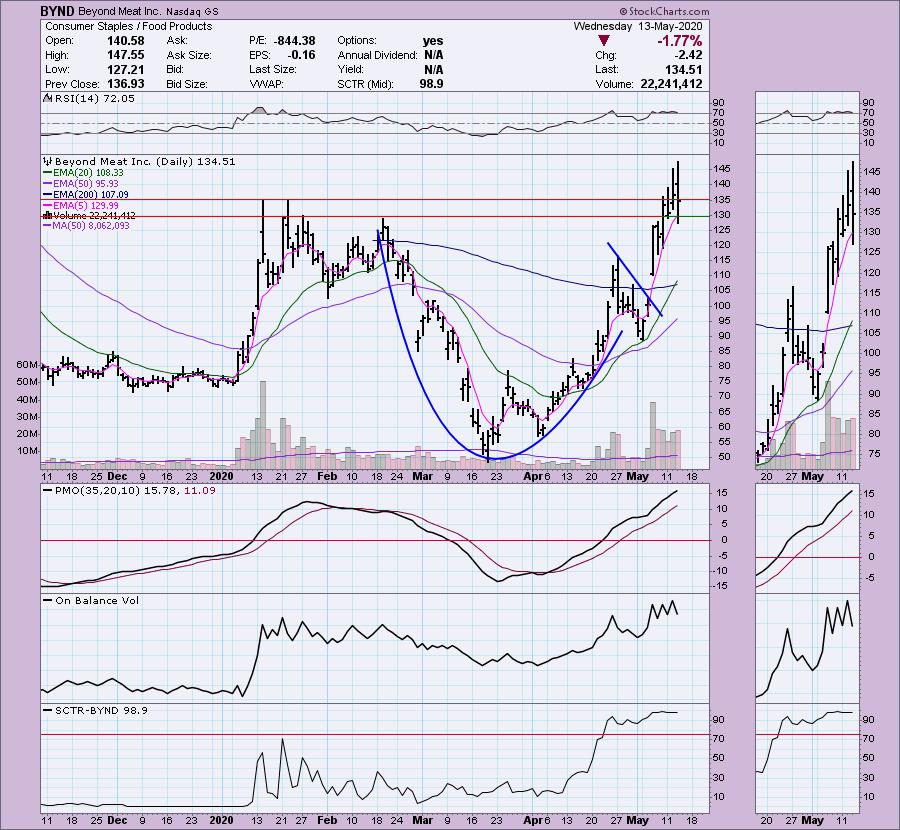
BYND is currently up 1.63% in after-hours trading. Today presents an excellent opportunity, given the pullback. The main negative I see on the chart is the overbought RSI, which can lead to more decline, as we've seen previously when the RSI has gotten overbought on BYND. Other than that, the chart is lovely, with a prominent cup and handle formation that has executed. PMO is rising, albeit a bit overbought.
Chart from 5/13:
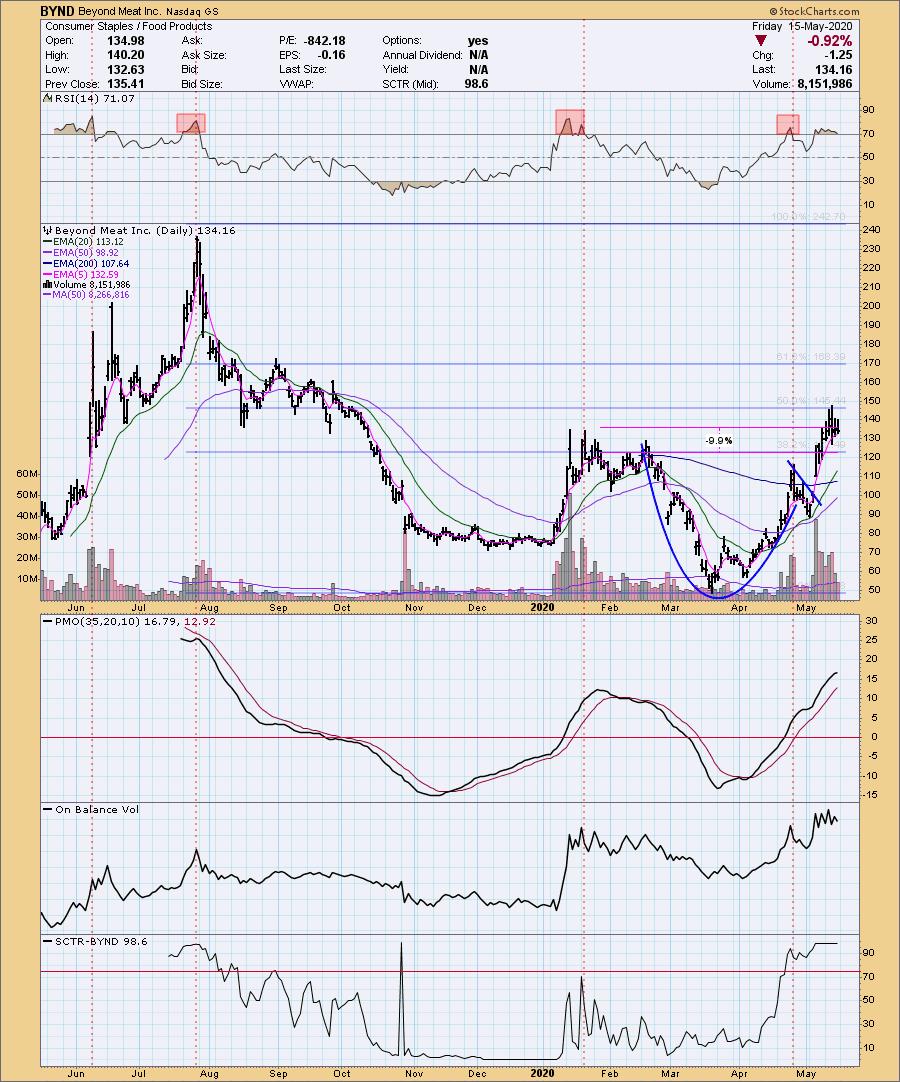
Today's Chart 5/15:
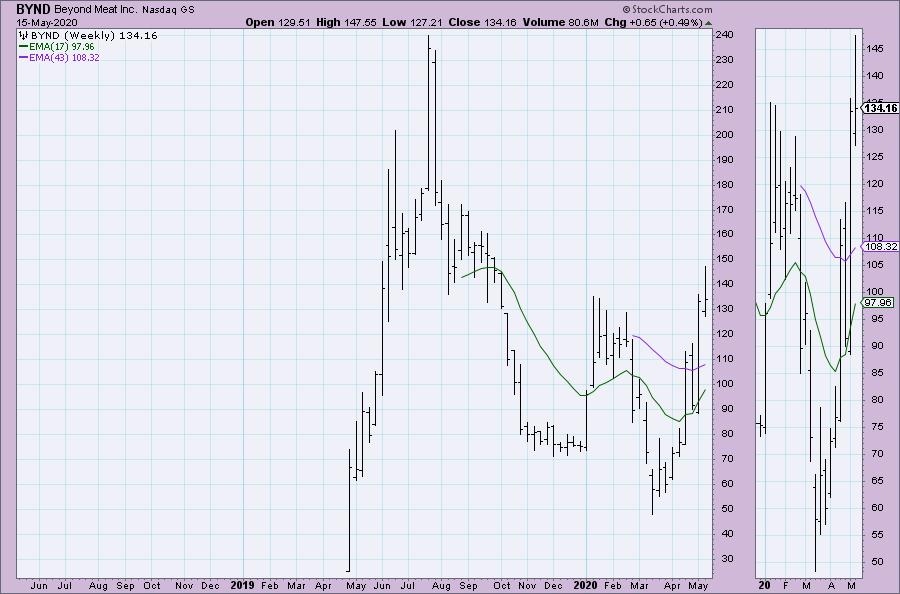
The weekly chart doesn't have much information, but it has enough to show us an interesting large double-bottom pattern that is trying to execute. Even if we look at the June top as a target, that's an over 50% gain. I would probably watch what happens at the $170 level."
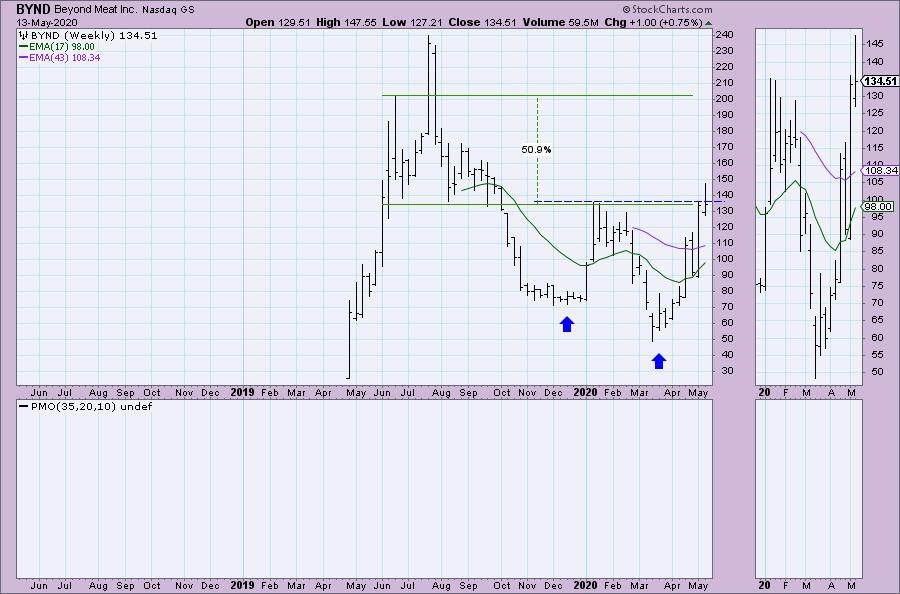
Today's Weekly Chart (5/15):
Technical Analysis is a windsock, not a crystal ball.
Helpful DecisionPoint Links:
DecisionPoint Alert Chart List
DecisionPoint Golden Cross/Silver Cross Index Chart List
DecisionPoint Sector Chart List
Price Momentum Oscillator (PMO)
Swenlin Trading Oscillators (STO-B and STO-V)


