 StockCharts calculates and publishes the Bullish Percent Indexes for several major indexes and sectors. Just search for the term $BP to find them because all the symbols begin with these three characters. These indicators are not part of my breadth models for broad market timing, but I do follow them, especially the S&P 500 Bullish Percent Index ($SPXBPI).
As with the %Above 200-day EMA indicators, I set the bullish and bearish thresholds at 60% and 40%, respectively. A move above 60% shows enough P&F double top breakouts to warrant a bullish environment, while a move below 40% shows enough P&F double bottom breakdowns to warrant a bearish environment. A Bullish Percent Index at 40% means 40% of stocks have double top breakouts, which implies that 60% have double bottom breakdowns.
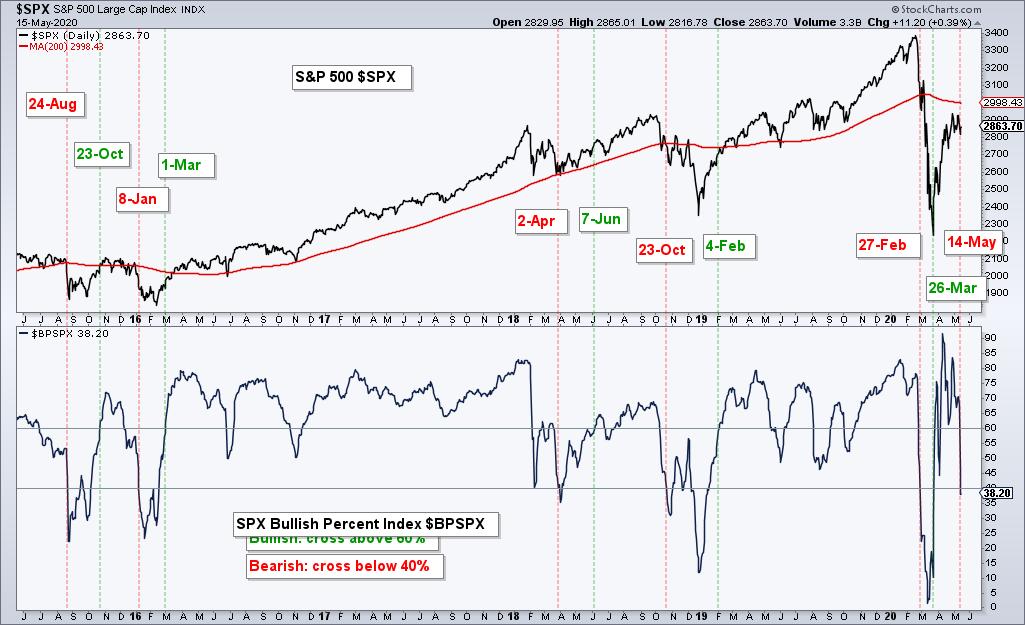
I place my signal lines above the midpoint (50%) to reduce whipsaws and generate more convincing signals. Try as I might, whipsaws are part of life for trend indicators. Trend following indicators will not catch the exact bottom or top and they will generate some bad signals, but they should also catch some good trends to make up for these drawbacks. That's the theory, at least.
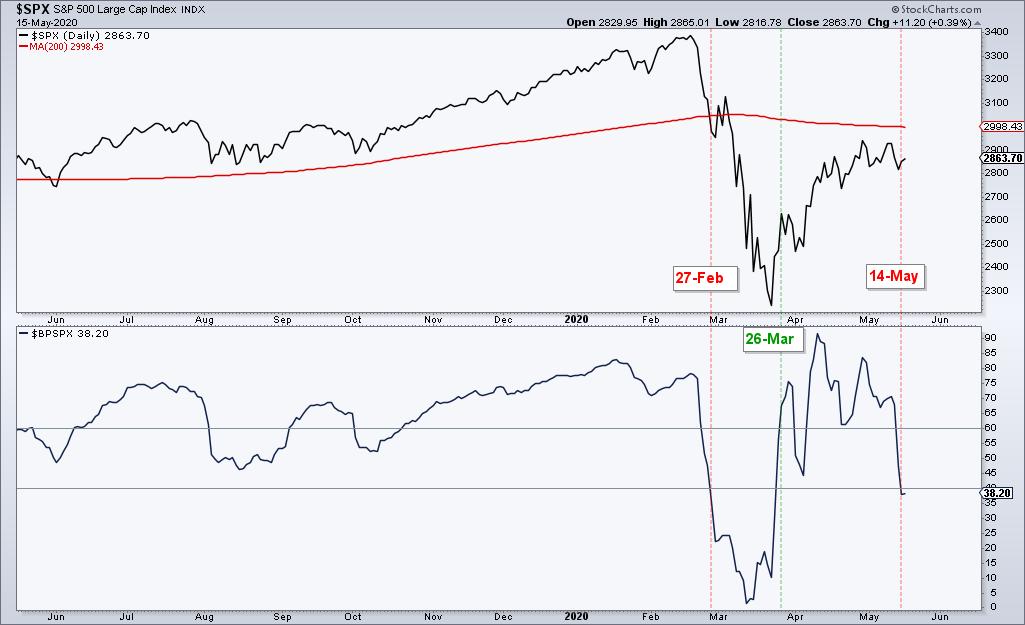
The chart above shows the most recent signals with a bearish signal triggering on Thursday's close. Notice that BPI plunged with a move from 84% on April 29th to 38% on May 14th. This means that some 62% of stocks in the S&P 500 moved below their prior reaction low. In P&F terms, this means current O column exceeded the prior O column for a double bottom breakdown. This shows a lot of weakness within the index and could mark a near-term top.
Interested in breadth indicators? Get the Essential Breadth Indicator ChartList with your subscription to TrendInvestorPro.com. This list features over two dozen breadth indicators for the major indexes and sectors. We've done the hard work for you by customizing these charts and organizing them in a logical top-down manner. This list alone is worth the price of a month's subscription.
Click here to take your analysis to the next level!
---------------------------------------------
Choose a Strategy, Develop a Plan and Follow a Process
Arthur Hill, CMT
Chief Technical Strategist, TrendInvestorPro.com
Author, Define the Trend and Trade the Trend
Want to stay up to date with Arthur's latest market insights?
– Follow @ArthurHill on Twitter
