Sixty-Five Year Record of Success
One of my favorite long-term indicators involves the 12-month ROC of the S&P Composite falling below the -5% level and subsequently rallying back above zero. This approach is shown in Chart 1, which illustrates the period from 1995 through April 30 of this year. Chart 2 covers the period between 1953 and 1995. The -5% line is shown in blue while zero is in black. The green arrows in Chart 1 flag the signals that have been triggered since the mid-1990s. Based on a one-year holding period, only one of the 19 signals that have been generated since 1953 has been unprofitable. That exception developed in 1957, but the ROC only held above zero for one month.
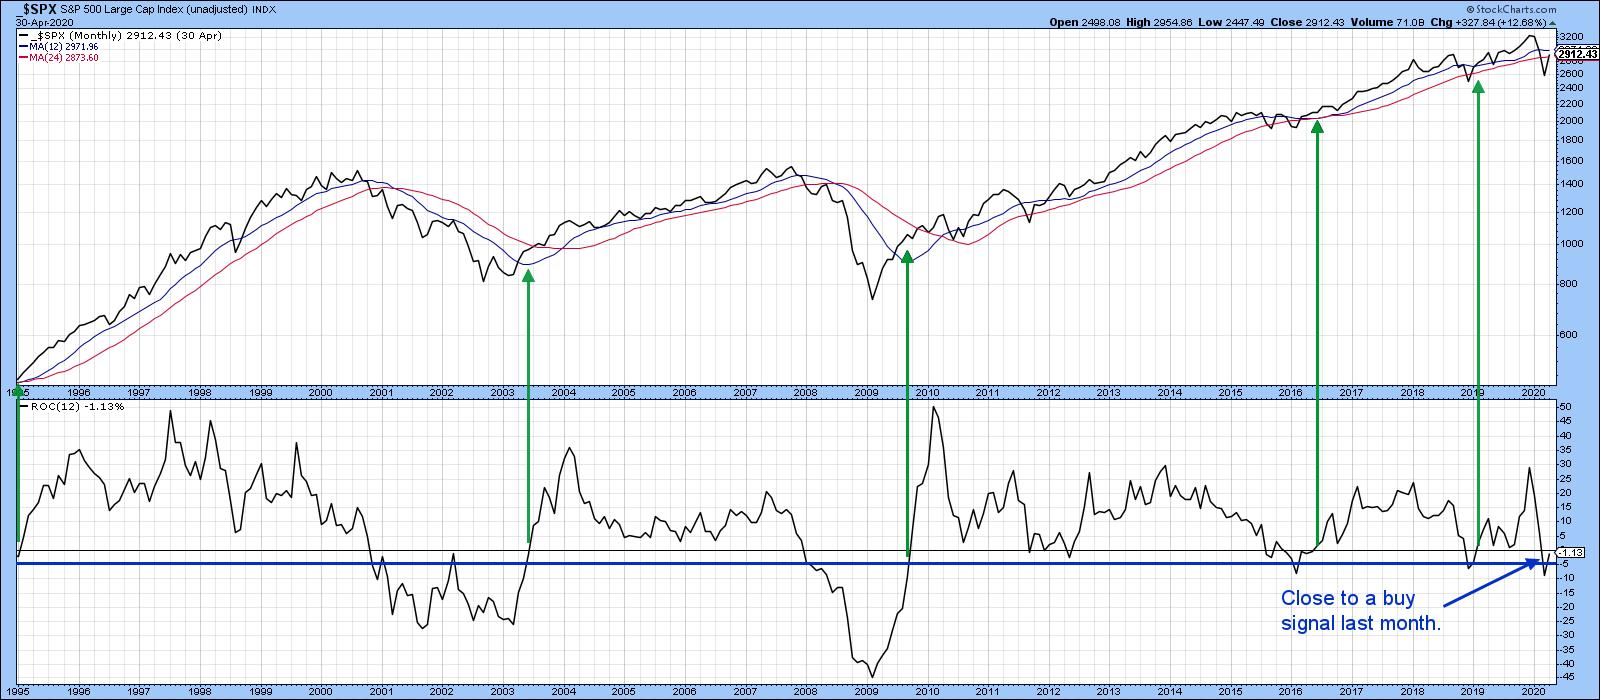 Chart 1
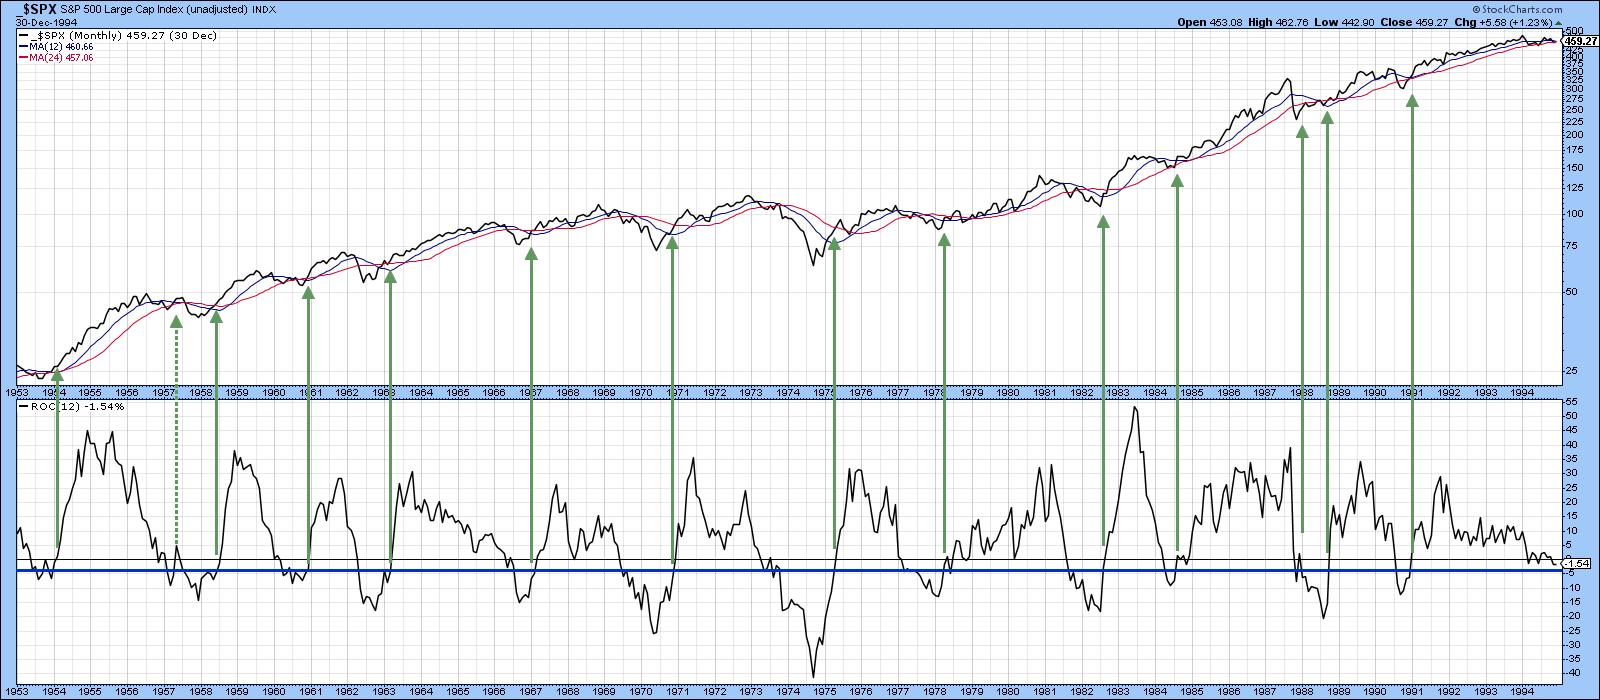 Chart 2
Chart 1 also shows that the model is not yet bullish, as the ROC remains below zero. The reason why this technique interests me is because the closing price for May of last year was 2752 and the latest May 7 price is around 2880. That means that the May 2020 closing low could fall around 120 points or so from current levels and still turn the model bullish. Since the market has risen in excess of 30% off its March 23 intraday low, the question naturally arises as to whether that's possible. The answer is unknowable, of course, but it is possible to point out some benchmarks that place things in greater perspective.
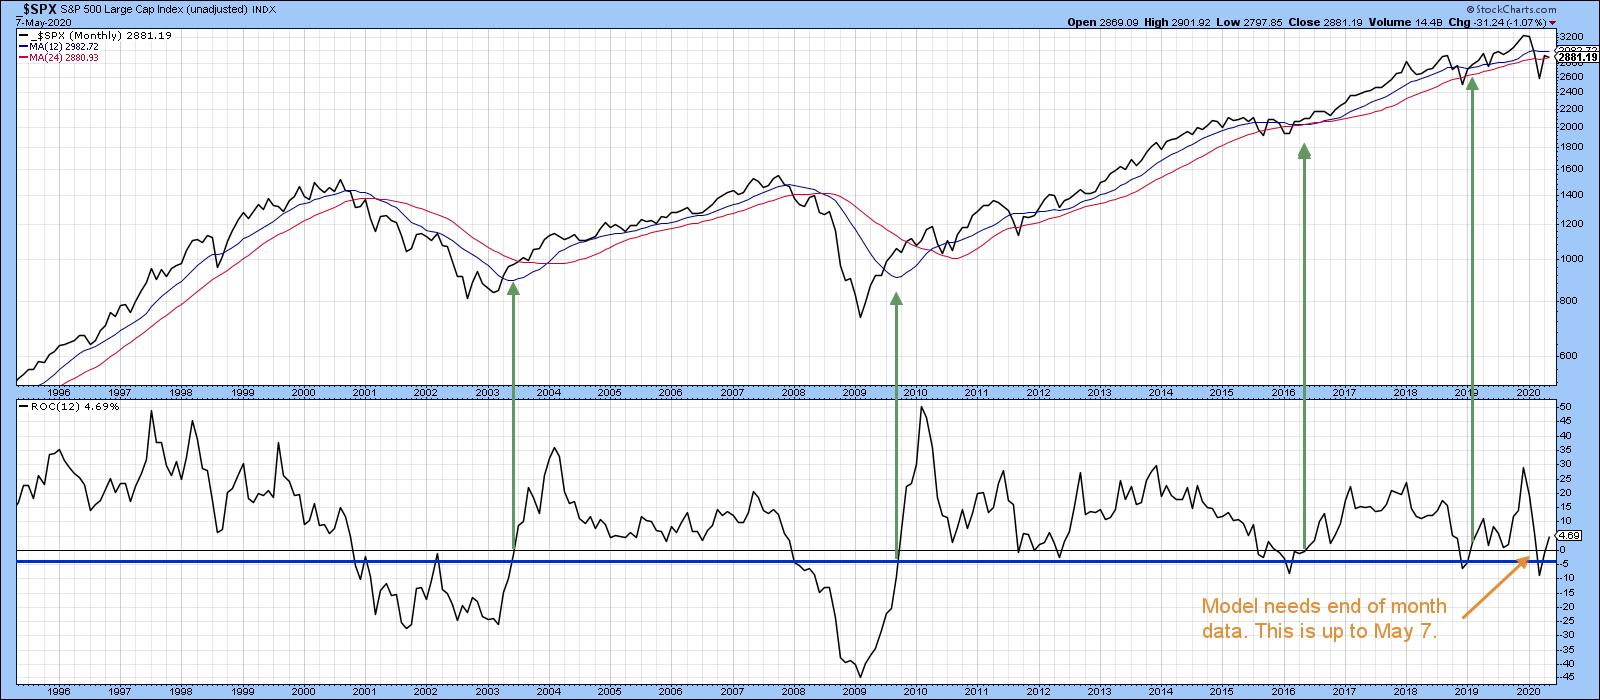 Chart 3
Extreme Overboughts and Oversolds
First, take a look at Chart 4, which features the 10-day MA of the S&P Composite's 12-day ROC. Two events recently happened. The first was an exceptionally extreme oversold reading in March, while the second was a close-to-record overbought condition in April. Normally, these extreme oversolds develop at the tail end of a bear market, when prices have been dropping for a year or more. If they occur close to an all-time peak, as in the 1987 example, this usually indicates a change of sentiment to the bearish side. Such conditions, known as mega-oversolds, offer the first early bird (in terms of time) signal that a new bear market is underway. In the 1987 case, that did not pan out because the mega-oversold was immediately followed by an above-average overbought reading, which had the effect of cancelling it. Remember, markets are nothing more or less than people in action, and people can and do change their minds. It's not therefore unreasonable for markets to do the same thing, as in the 1987 situation (from an extreme pessimistic oversold to a more optimistic above-average overbought reading).
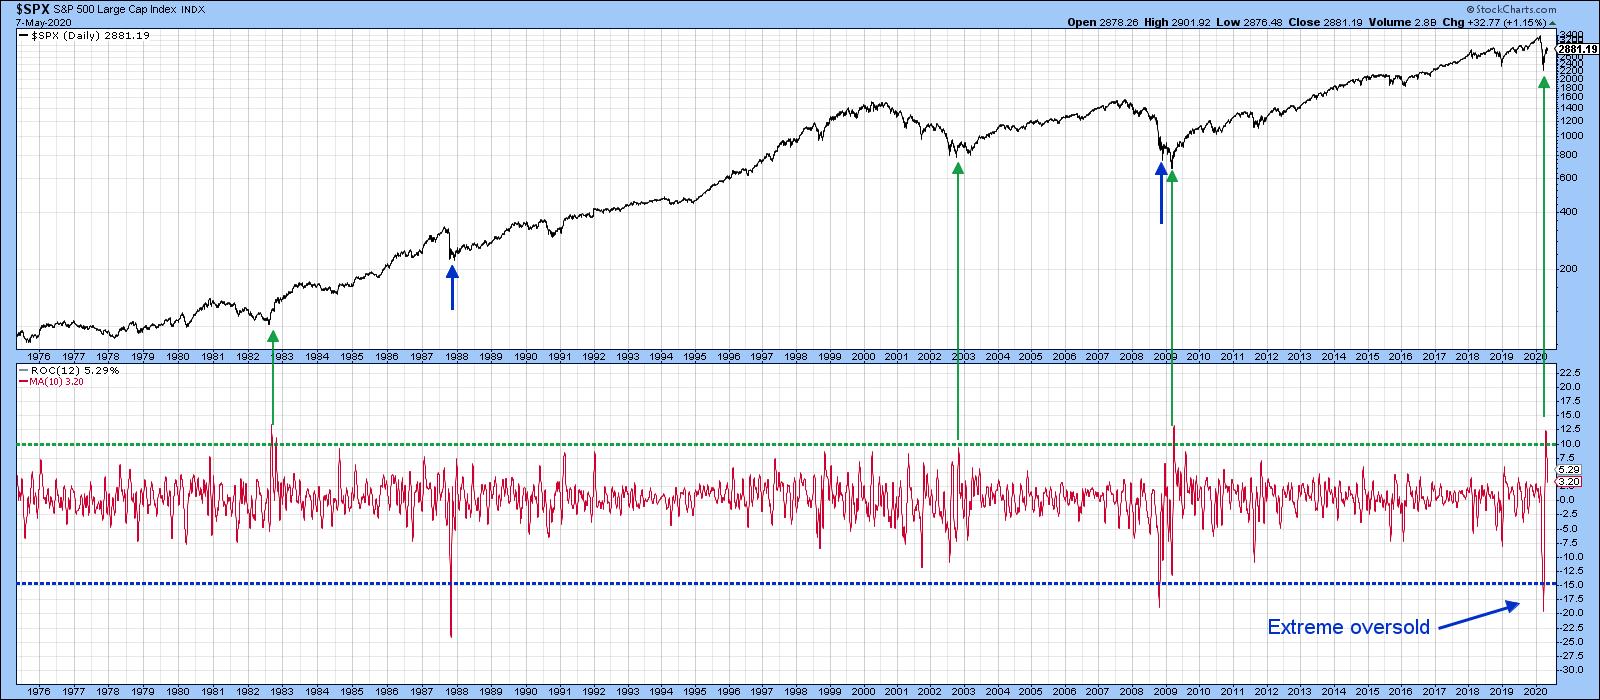 Chart 4
Editor's Note: This is an excerpt of an article that was originally published in Martin Pring's Market Roundup on Thursday, May 7th at 6:59pm ET. Click here to read the full article, which includes Charts 5-6 and a discussion of why we might see a test of the low.
Good luck and good charting,
Martin J. Pring
The views expressed in this article are those of the author and do not necessarily reflect the position or opinion of Pring Turner Capital Group of Walnut Creek or its affiliates.


