Most of my guests in recent weeks on The Final Bar have embraced the "we're due for a pullback" thesis. From the very bullish (S&P 3600) to the quite bearish (S&P 2000) and everyone in between, it seems most people feel that the uptrend from the March lows appears to have run its course.
Having said that, the short-term breadth picture actually speaks to a market in decent shape. I've spoken about the bear market rally perspective elsewhere, including the fact that the $SPX has retraced just about 61.8% of its initial selloff, which is in line with previous bear market cycles. Here, I wanted to focus in particular on the breadth characteristics of the last six weeks and why they portray a surprisingly constructive short-term setup.
One of my favorite ways to measure breadth is using the cumulative advance-decline lines, which I do so for the S&P 500, the NYSE, the mid-cap S&P 400 and the small-cap S&P 600.
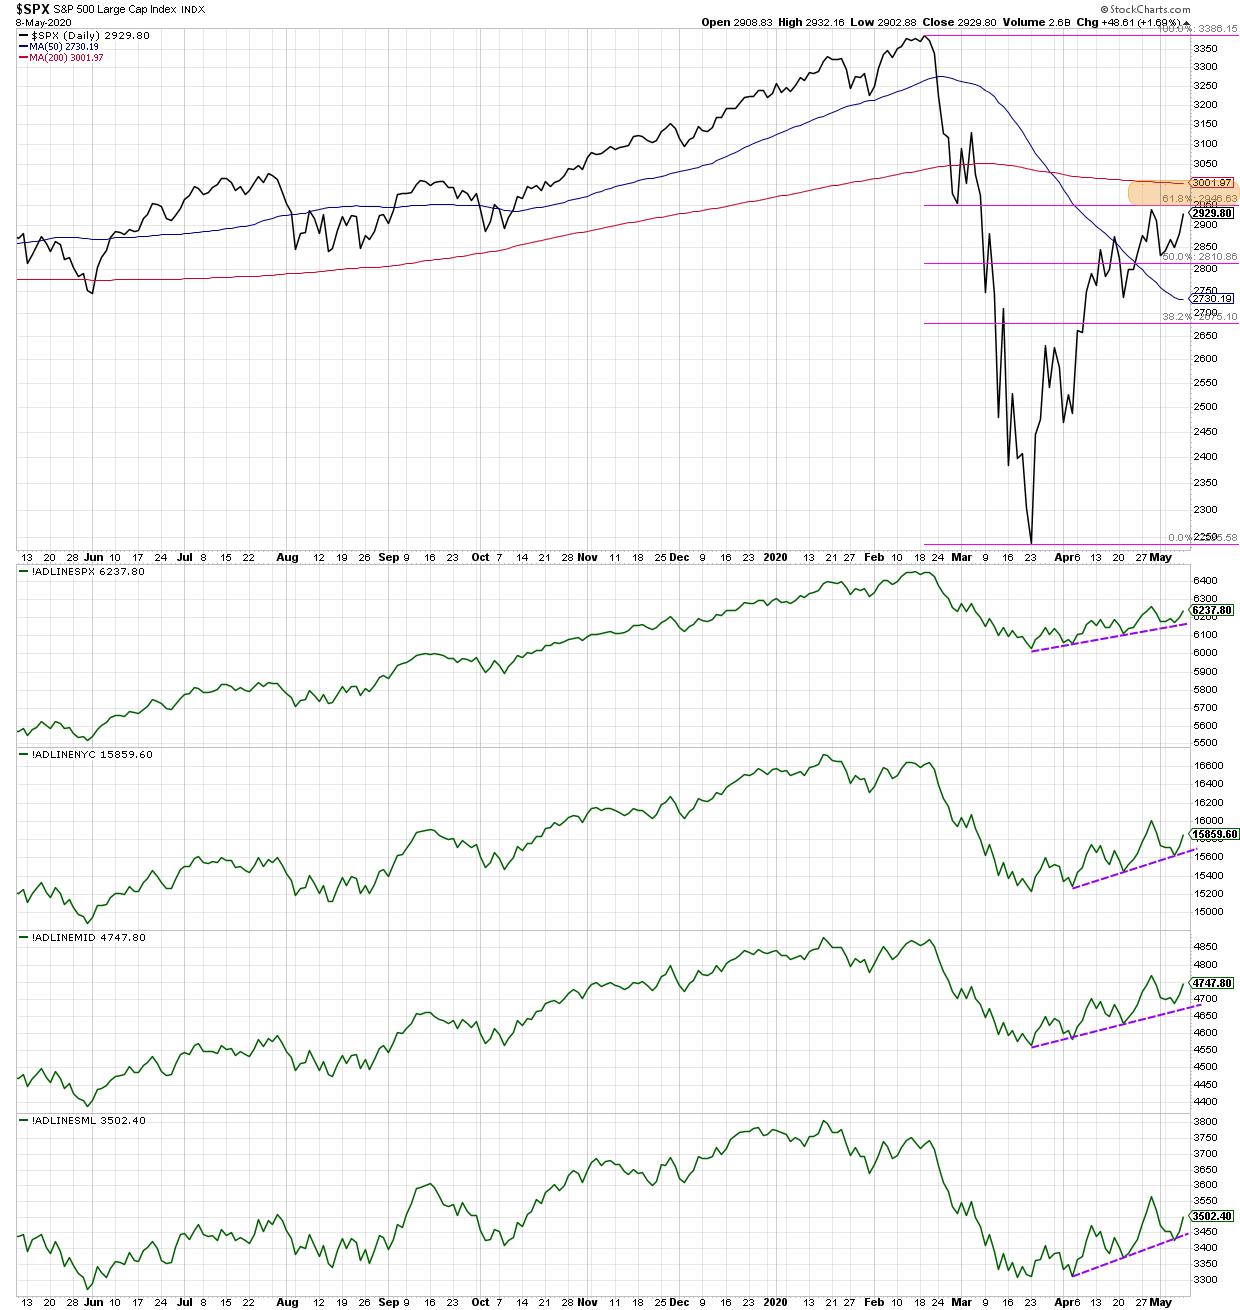
One of the many sets of divergences at the February market top was where the NYSE and small-cap A/D lines actually made lower peaks, while the S&P 500 index made higher highs. This spoke to a lack of participation from the smaller, more speculative portions of the US equity markets.
Since the March low, however, the advance-decline lines have been moving higher in lockstep. All four breadth indicators have formed a consistent pattern of higher highs and higher lows, in line with the chart of the S&P itself. All cap tiers have participated in the upswing over the last six weeks.
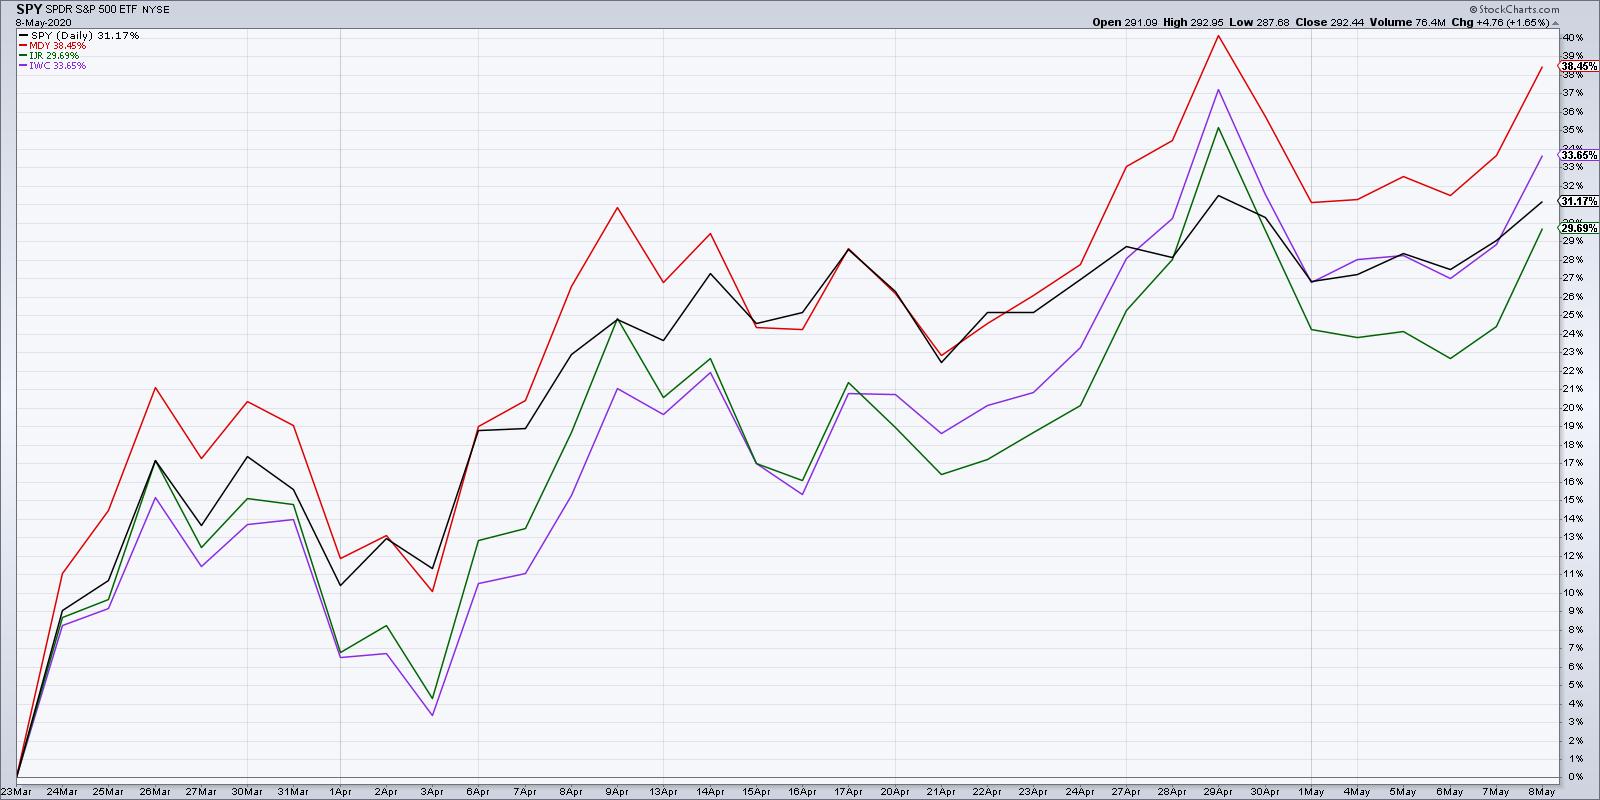
While many investors think that market has been led solely by the mega-cap stocks in technology, Communication Services and Consumer, the strongest performer since the March lows is actually the mid-cap index! So there has indeed been broad participation in this current upswing.
So how does this uptrend in breadth reconcile with the bear market rally thesis?
Quite simply, this is the type of movement that draws in many investors to believe that the bear market is over. Some call this sort of environment a "bull trap", as it sucks investors in and leads them to believe "the worst is already behind us."
The market has impressed with its resiliency. The cumulative advance-decline lines tell us that it's not just the mega caps that are rising, but that a rising tide has indeed lifted all boats. The challenge here is that whether you're a long-term bull or a long-term bear, as both camps likely feel that their particular view has been validated based on the strength of this recent up move.
The most important signal is what comes next.
Option 1 is that the S&P 500 completes the move above the key 3000 level, confirming a break above that final resistance between current levels and the February high (around 3400). The cumulative advance-decline lines continue their trend of higher highs and higher lows, while charts like the biotech index continue to follow through to the upside.
Option 2 is that the S&P 500 starts to falter as it fails to reclaim its 200-day moving average and does not reach above its 61.8% retracement level. Charts like the IBB become failed breakouts as they trade back below recent support levels. Most importantly, the cumulative advance-decline lines in today's chart break below trendline support, eventually leading to lower highs and lower lows.
Based on my studies of market history and price dynamics, I have to assume that Option 2 is much more probable. I also have to admit that Option 1 is a possibility. And I have to insist that the cumulative advance-decline lines will be one important way to determine which of these options becomes reality.
RR#6,
Dave
David Keller, CMT
Chief Market Strategist
StockCharts.com
Disclaimer: This blog is for educational purposes only and should not be construed as financial advice. The ideas and strategies should never be used without first assessing your own personal and financial situation or without consulting a financial professional.
The author does not have a position in mentioned securities at the time of publication. Any opinions expressed herein are solely those of the author and do not in any way represent the views or opinions of any other person or entity.


