It's been quite a week for the markets, as a gradual reopening from a global lockdown has investors hopeful that economic damage from the pandemic might be stemmed.
And while the S&P 500 posted a healthy gain for the week, it's the Tech-heavy Nasdaq that's been leading the charge higher, with the index up 5.9% this week alone. With individual stocks up even more, you may be finding it difficult to determine the best candidate that will improve your odds of profitably participating in the market's current uptrend.
Below, I'll share with you 3 characteristics of a stock poised to outpace the broader markets using historical precedent. These are among numerous key characteristics I learned from my many years working with William O'Neil & Co. – a company that specializes in uncovering winning outperformers.
The first trait is that the company has to have strong growth prospects in the form of earnings and sales that are trending higher. While that might seem like a difficult feat in a period of historical unemployment and a global economy that's in lockdown, there are many companies reporting results above estimates as their products are facing strong demand.
In fact, over 60% of companies that have reported their most recent quarter have posted positive results, with a select number showing no signs of a slowdown for this year. The response from investors has been enthusiastic as over 75 stocks gapped up in price on the open today alone.
This leads us to the second trait that winning stocks can exhibit, particularly during earnings season: A breakaway gap-up on high volume following an event such as the release of a strong quarterly report. It's not unusual to see a leadership-quality stock rise 20% or more as volume surges above-average.
This last trait in the series, which I'm covering today, is when the gap-up in price, on heavy volume, pushes the stock out of a base pattern. Most commonly, it's a saucer-type base where the stock has pulled back from an attempted new high in price and now blows past that prior high.
DAILY CHART OF FORTINET, INC. (FTNT)
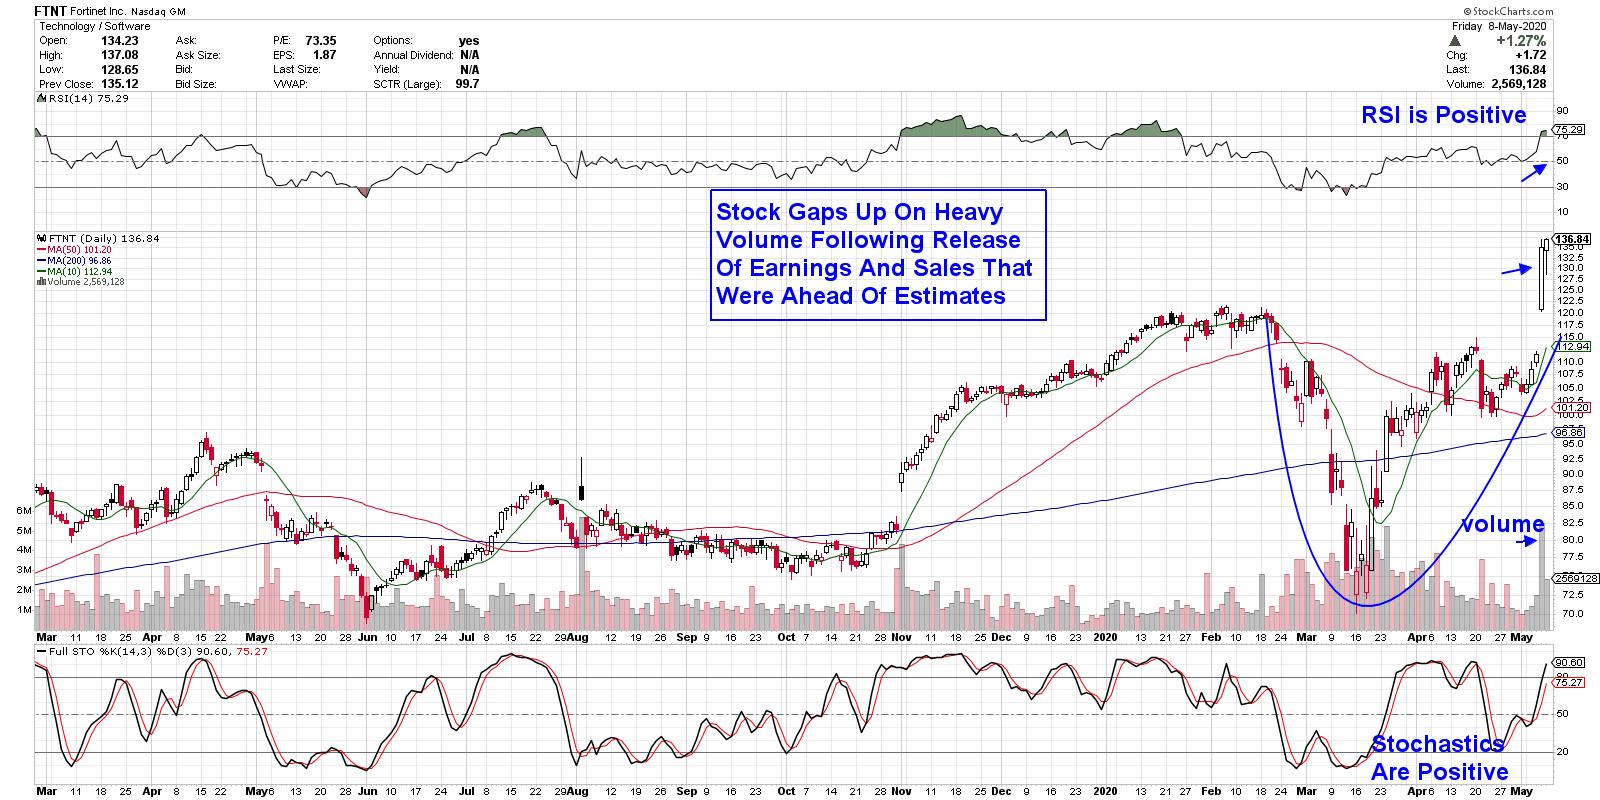
Above is Fortinet (FTNT), a company that provides cybersecurity solutions worldwide with their firewall security network. The company delivered a strong quarter after beating expectations on revenue, billings and EPS, as increased work-from-home activity drove demand for their products.
FTNT gapped up 21% on the day on above-average volume and, while the daily chart above is exhibiting bullish characteristics, below I've outlined how to determine a precise entry on the day of the stock's gap up after the open yesterday. In addition, I've highlighted an exit point that would have you sidestepping the 6% pullback from today.
15-MINUTE PRICE CHART OF FORTINET INC. (FTNT)
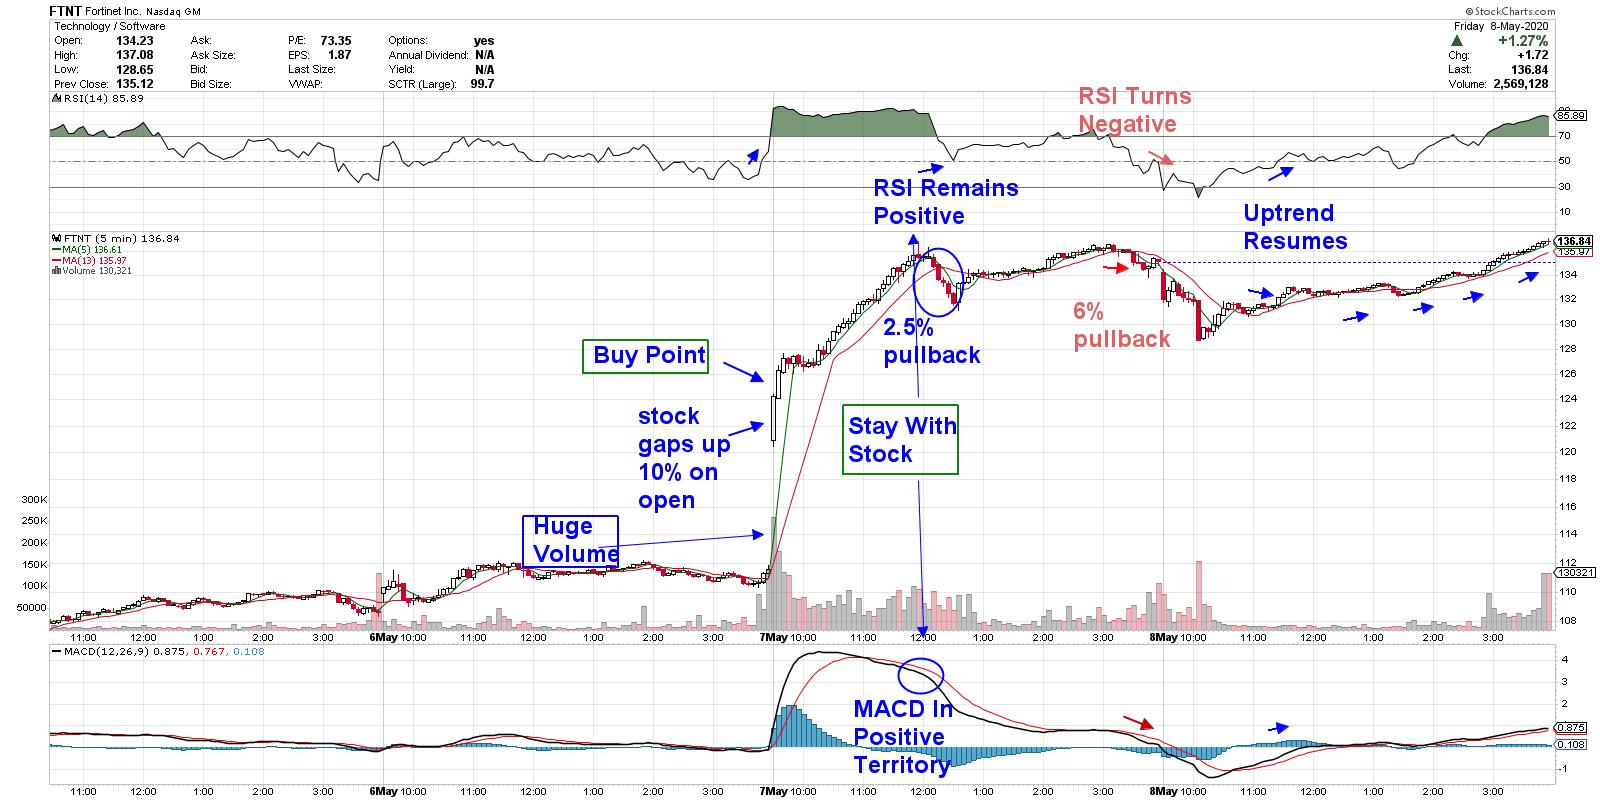
Using a price chart that drills down to the 15-minute price chart is normally reserved for shorter-term swing traders. However, it can be quite useful for longer-term investors as well, helping to pinpoint an entry point during this period of sharp intraday rallies we've been experiencing.
To begin, you'll want to wait until the first 5-minute bar is posted. When the stock surpasses the high of that bar, you can purchase the stock. You'll also want to make sure you have a confirming RSI and MACD. While FTNT experienced a nominal midday pullback, you'll notice that the RSI remained positive, which would keep you in the stock.
If the stock breaks below its key moving averages, combined with a negative RSI and MACD, shorter-term investors may want to take profits while longer-term investors would use a daily chart to stay with FTNT. Above, you'll see the bullish signals of the intraday, downtrend reversal as the stock broke back above is moving averages, with the other indicators turning positive as well.
To recap, a stock that releases a strong quarterly report with earnings that come in ahead of estimates, coupled with a breakaway gap up on volume that pushes the stock out of a base, will often go on to trade higher. The key here, however, is that the broader markets continue to advance, as you'll need a bullish market backdrop.
Fortinet Inc. is one of many stocks that are poised to trade higher following the release of strong fundamentals. If you'd like to uncover other high-quality growth stocks that will boost your portfolio, take a 4-week trial of my top-performing MEM Edge report for a nominal fee. This bi-weekly report is based on the O'Neil methodology and provides alerts to broad market trend shifts, as well as individual sector analysis and stock picks not seen anywhere else. Use this link here to take a look now!
"Your experience really shines through compared to other analysts offering similar products." Joe W.
"The reports not only pay for themselves, they provide an education in how to pick stocks. Thank you!" Ford B.
"Once again, thank you for the wonderful information and training that you provide on an ongoing basis. It really is nice to see some profits in my account." S.M.
Warmly,
Mary Ellen McGonagle,
MEM Investment Research