I remember hearing (and still hearing) from other analysts that one should remember that the bottom of the chart isn't a support level. This is especially true when you are looking at a stock that has been making new all-time lows. Yesterday, a DecisionPoint Diamonds reader requested I look at US Natural Gas (UNG) with an eye toward bottom fishing. In my mind, "bottom fishing" is finding an extraordinarily beat-down stock or ETF with the intention of catching the stock when it finally reverses. These type of investments carry a lot of risk, so position-size thoughtfully.
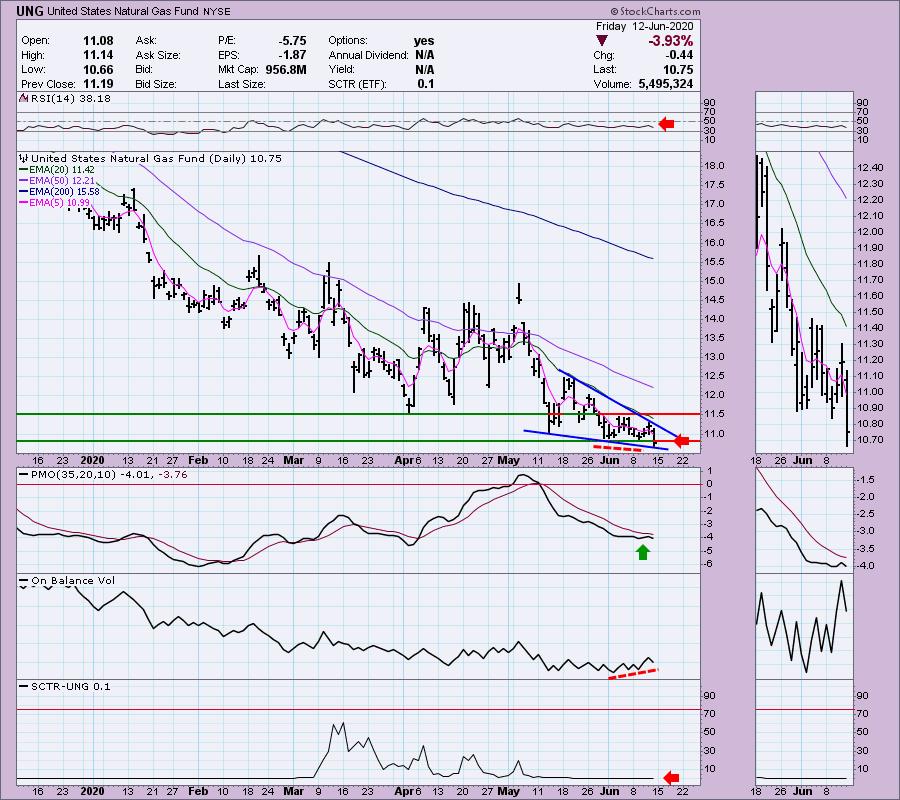
Yesterday's daily chart looked far more enticing as UNG had enjoyed two days of higher prices. It was forming a short-term double-bottom, it was in a bullish descending wedge pattern and it was seeing a positive divergence between OBV bottoms and price lows. The bearish RSI is a problem, but, as of yesterday, the PMO hadn't turned down yet. This definitely piqued my interest for a short-term trade.
As investors, we want to accomplish two basic things:
(1) Determine the trend and condition of the market and
(2) Select stocks that will ride that tide.
The DecisionPoint Alert helps with the first step, and DecisionPoint Diamonds helps with the second. Go to DecisionPoint.com and SUBSCRIBE TODAY!

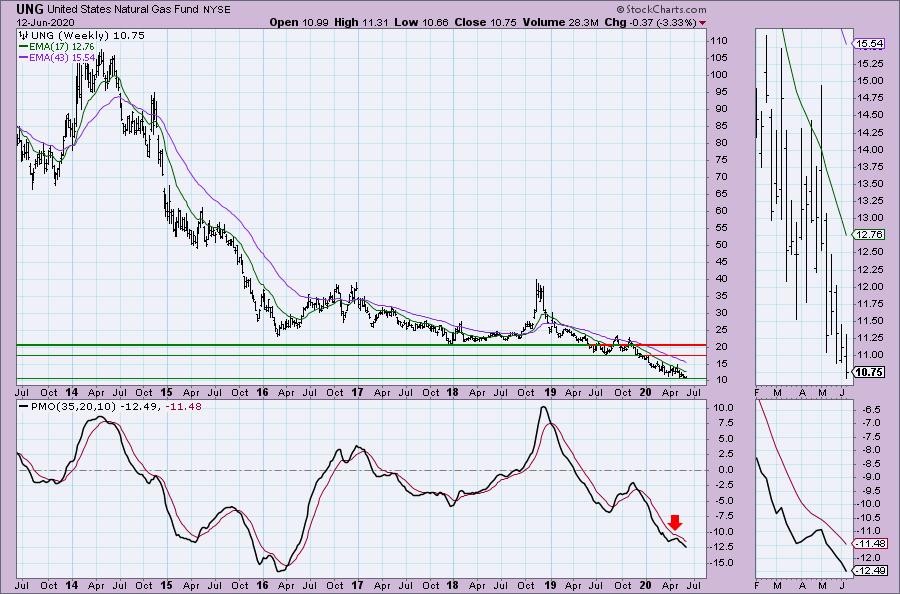
Then, I looked at the weekly chart below and realized there was no support except at the bottom of the chart... which wasn't zero. It was $10. While yesterday it looked like UNG might be able to turn it around off that support level, I did warn that new all-time lows were completely possible. Additionally, the weekly PMO wasn't favorable.
The monthly chart for UNG also tells me that, if I were to trade it, it should be considered a VERY short-term investment, one that would need to be watched continually all day. The PMO is on a SELL signal and isn't in oversold territory yet.

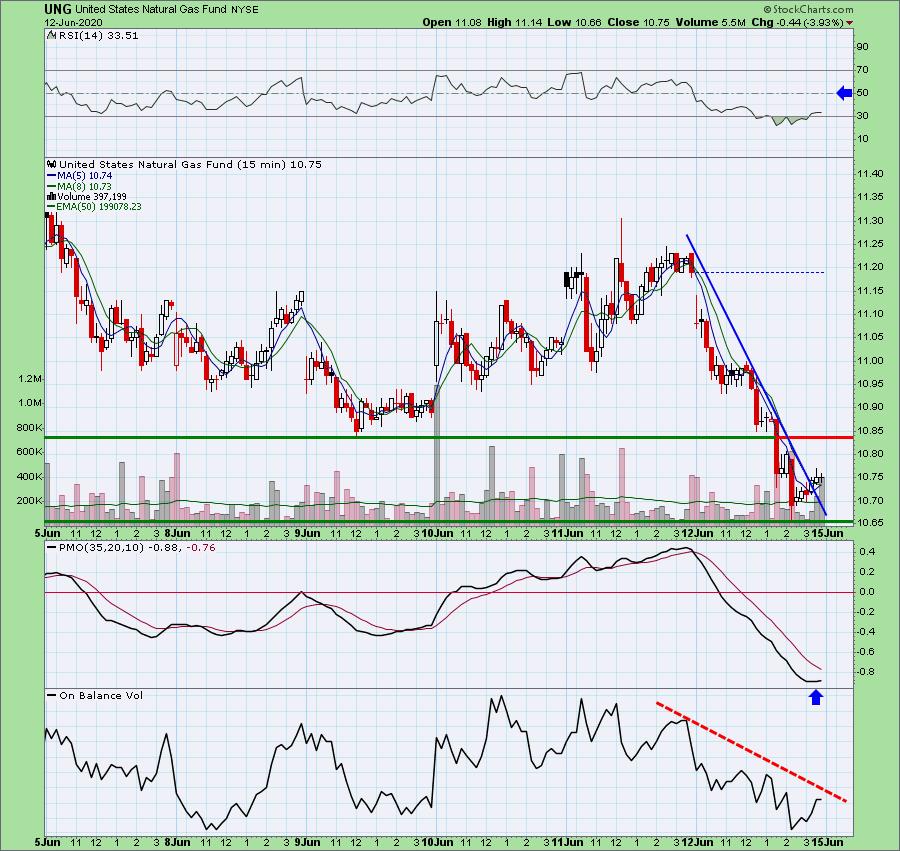
If you are thinking of risking a small position, here's a look at the 15-min bar chart. It gives us hints as to where we might look for an entry. I've marked support at today's low; it's at the bottom of the chart, but we know it could fall further. It does appear that UNG is ready to rally. The PMO has turned up and the RSI has risen out of oversold territory. Notice that overhead resistance is right there. I would be watching to see if:
- Support holds at the all-time low
- The RSI reaches above 50
- The PMO has a positive crossover
- Overhead resistance is broken
That would be the safest entry, although you could go in early and, if indicators don't turn bullish, you could then exit. Remember, these very short-term charts are quite helpful for timing your entries.
Conclusion: It may seem silly to even write about the bottom of the chart not being support. However, the brain may make visual assumptions or set biases that you're not always aware of. I do want to caveat that UNG hasn't formally set a bottom that could be considered support on the daily/weekly/monthly bar charts. Until we have a higher intraday low, a true support line hasn't been set.
If you'd like a trial to our website newsletters, contact support@decisionpoint.com and we will hook you up!
Happy Charting! - Erin
Diamond of the Week (Tuesday 6/9 DP Diamonds Report):
Below is the original article, but I have updated the charts through today and have added new commentary in italics.
Gilead Sciences Inc (GILD) - Earnings: 7/30/2020 (AMC)
"I owned this one, having purchased it after I presented it as a "Diamond in the Rough" in April. After it gapped up and got to my target at the March high, I waited to see what might happen given its position in the news cycle regarding a new vaccine. When it began to tumble, I sold it and made a profit I was good with. Well, this one could be ready to make another move. We have a double-bottom pattern. It failed to execute on yesterday's breakout when it closed back within the pattern. Today it wasn't able to breakout but it stayed comfortably above the 5-EMA. The RSI has now moved back above 50. The PMO triggered a crossover BUY signal. The OBV is confirming the rally and the SCTR is rising." Obviously, this one did not work out this week, but most stocks took a huge hit Thursday. However, this has increased the potential gains available on a stock that still has bullish characteristics. While the RSI did drop below 50, it is neutral and the SCTR is healthy. The PMO had a whipsaw SELL signal that I can overlook based on the strength of the decline yesterday. The best element of the chart would be the OBV positive divergence. While I still have the double-bottom annotated, we could be seeing a triple-bottom lining up.
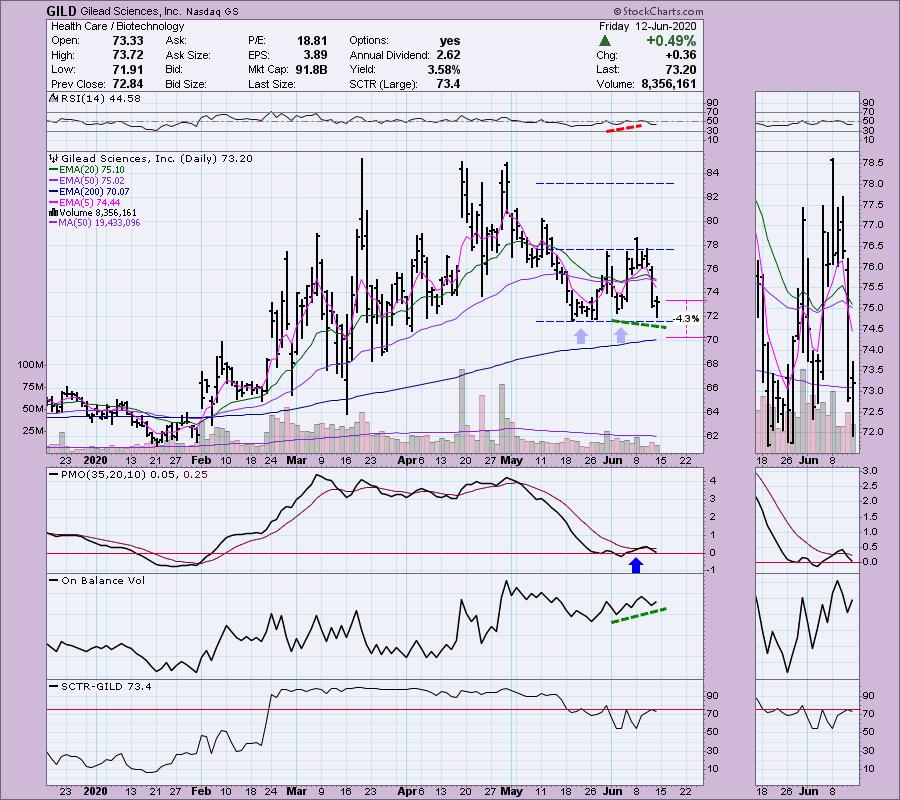
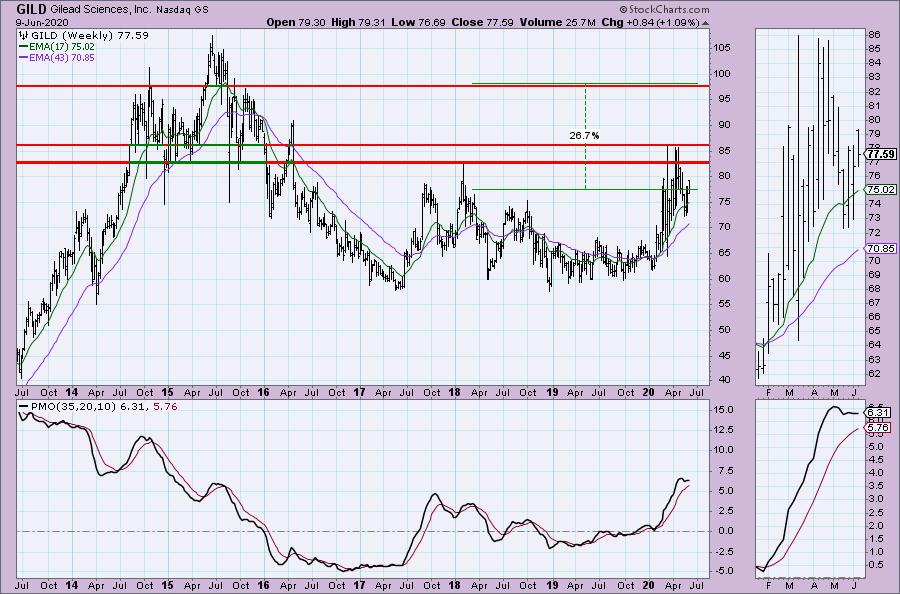
The most difficult overhead resistance is probably around $82.50, but I believe it will break above given the weekly PMO trying to turn up.
Technical Analysis is a windsock, not a crystal ball.
Helpful DecisionPoint Links:
DecisionPoint Alert Chart List
DecisionPoint Golden Cross/Silver Cross Index Chart List
DecisionPoint Sector Chart List
Price Momentum Oscillator (PMO)
Swenlin Trading Oscillators (STO-B and STO-V)


