 The 20+ Yr Treasury Bond ETF (TLT) retreated as stocks advanced from mid April to early June and then popped as stocks dropped this week. Bonds are the natural alternative to stocks and TLT appears to be forming a classic bullish continuation pattern.
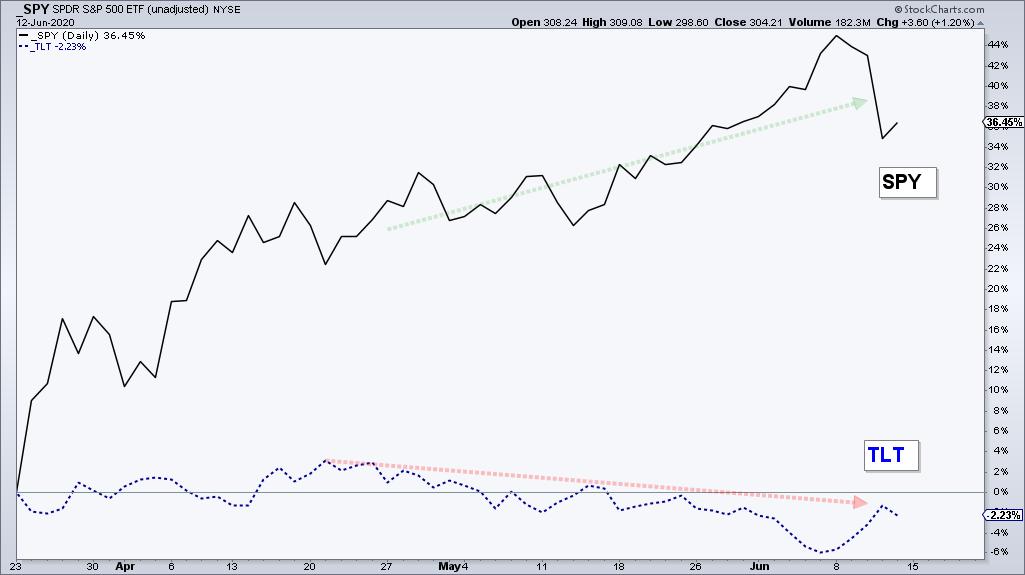
Let's first compare performance for these two opposites. Year-to-date, TLT is up 18.62% and the S&P 500 SPDR (SPY) is down 5.20%. However, performance looks a little different when we start from March 23rd, which is when SPY bottomed. SPY is up some 36% and TLT is down around 2%. The decline is not drastic, but safe-haven bonds clearly underperformed when riskier stocks surged.
The next chart shows TLT surging to a new high as stocks plunged in March and then forming a possible cup-with-handle pattern. Note that this pattern is still early stages because TLT has yet to confirm with a break above rim resistance.
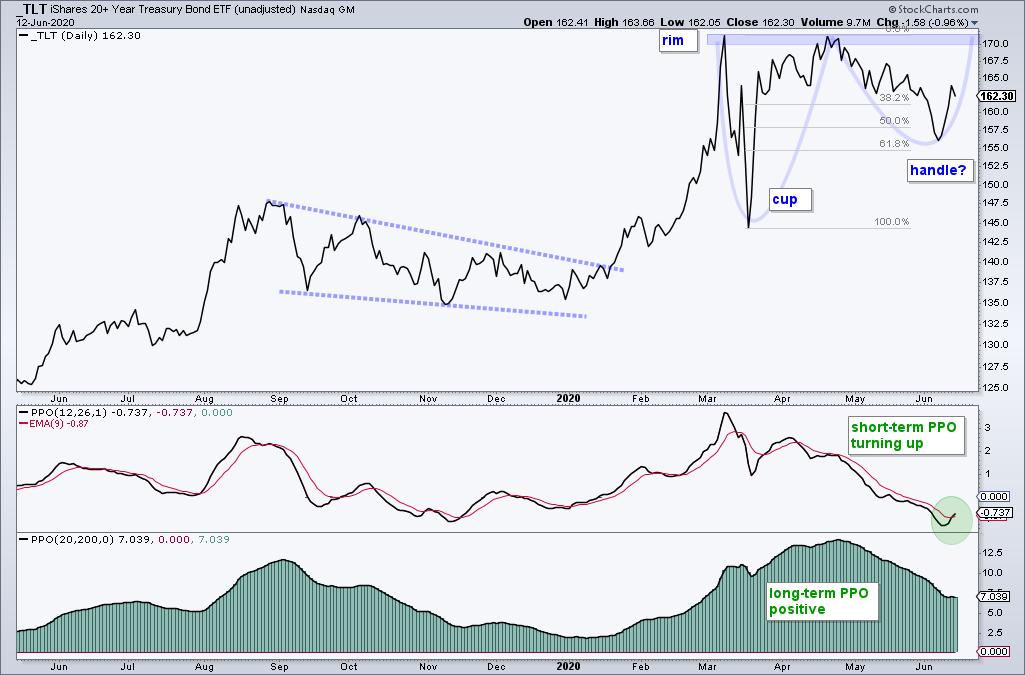
This week's reversal in a key retracement zone and upturn in the PPO suggests that a resistance challenge is imminent. Notice how the April-June decline retraced 50-61.8% of the March-April advance. This is normal for a correction and the PPO signal line cross indicates an upturn in momentum.
This week on TrendInvestorPro I tested a five indicator breadth model going back to the beginning of decimalization (2/1/2001). This model's returns are as good as buy-and-hold for SPY, but with much lower drawdowns and less exposure (risk). Such models can help you stay on the right side of the market and a new signal triggered this week. Get immediate access with a subscription to TrendInvestorPro.
Click here to take your analysis to the next level!
-----------------------------------
Choose a Strategy, Develop a Plan and Follow a Process
Arthur Hill, CMT
Chief Technical Strategist, TrendInvestorPro.com
Author, Define the Trend and Trade the Trend
Want to stay up to date with Arthur's latest market insights?
– Follow @ArthurHill on Twitter


