 There were a number of Bollinger Band squeeze plays over the last two weeks and also a number of breakouts. These breakouts are bullish until proven otherwise, but chartists should also be aware of the head fake. In his book, Bollinger on Bollinger Bands, John Bollinger puts it as follows: "Traders beware! There is a trick to The Squeeze, an odd turning of the wheel that you need to be aware of, the head fake".
A Bollinger Band squeeze occurs when Bollinger Bands narrow and volatility contracts. In theory, this volatility contraction gives way to a volatility expansion or a significant price move. The first directional clue comes from the direction of the break. An upside breakout after a contraction is bullish, while a downside break is bearish.
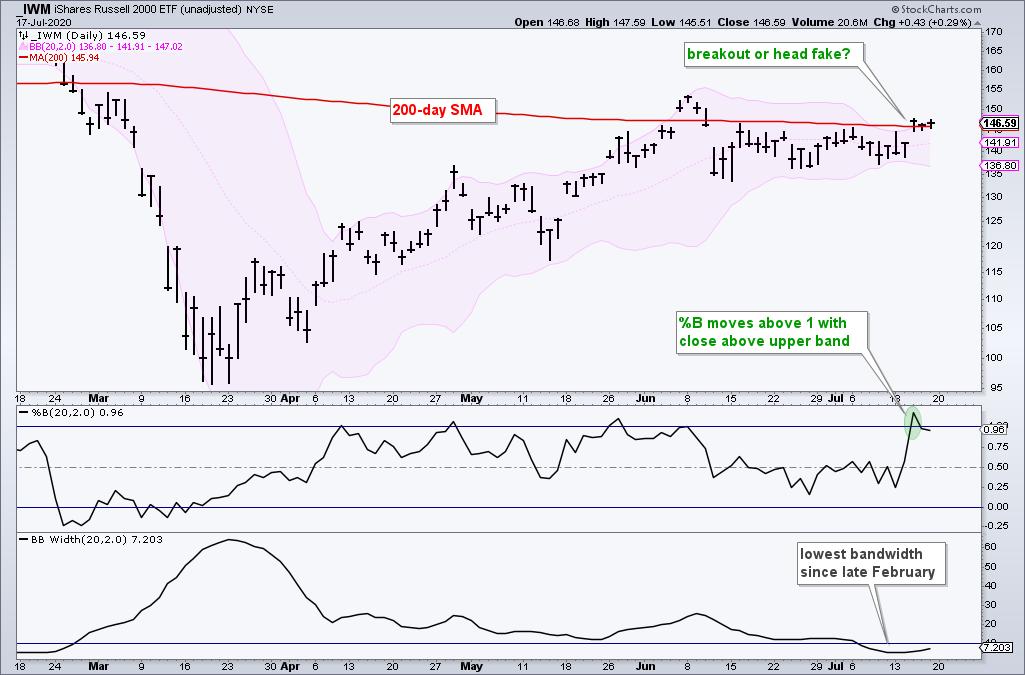
The chart above shows the Russell 2000 ETF (IWM) with the Bollinger Bands in pink, %B and Bandwidth. Notice that Bandwidth dipped to its lowest level since February as the bands narrowed into mid July. Price broke above the upper band and the 200-day on Wednesday and then stalled around the upper band.
Regarding the head fake, Bollinger notes that price often stages a short head fake move in one direction, turns suddenly and then moves sharply in the other direction (Bollinger on Bollinger Bands p. 121). The current breakout is still bullish, but this is something to monitor in the coming days. Failure to hold the breakout and a break below the June lows would be bearish.
This week at TrendInvestorPro.com:
- Bearish wedges were put on hold as several ETFs held support and triggered short-term breakouts (Monday).
- A rotation is underway as money moved out of tech-related ETFs and into some lagging ETFs (Thursday).
- Stocks are performing well since late March, but so are Treasuries and gold (Friday)
- Weekend video covering long-term trend, breadth models, gold, bonds, seasonal patterns (SPY, IWM, GLD, TLT), Fed balance sheet and yield spread.
Click here to take your analysis to the next level!
---------------------------------------------
Choose a Strategy, Develop a Plan and Follow a Process
Arthur Hill, CMT
Chief Technical Strategist, TrendInvestorPro.com
Author, Define the Trend and Trade the Trend
Want to stay up to date with Arthur's latest market insights?
– Follow @ArthurHill on Twitter


