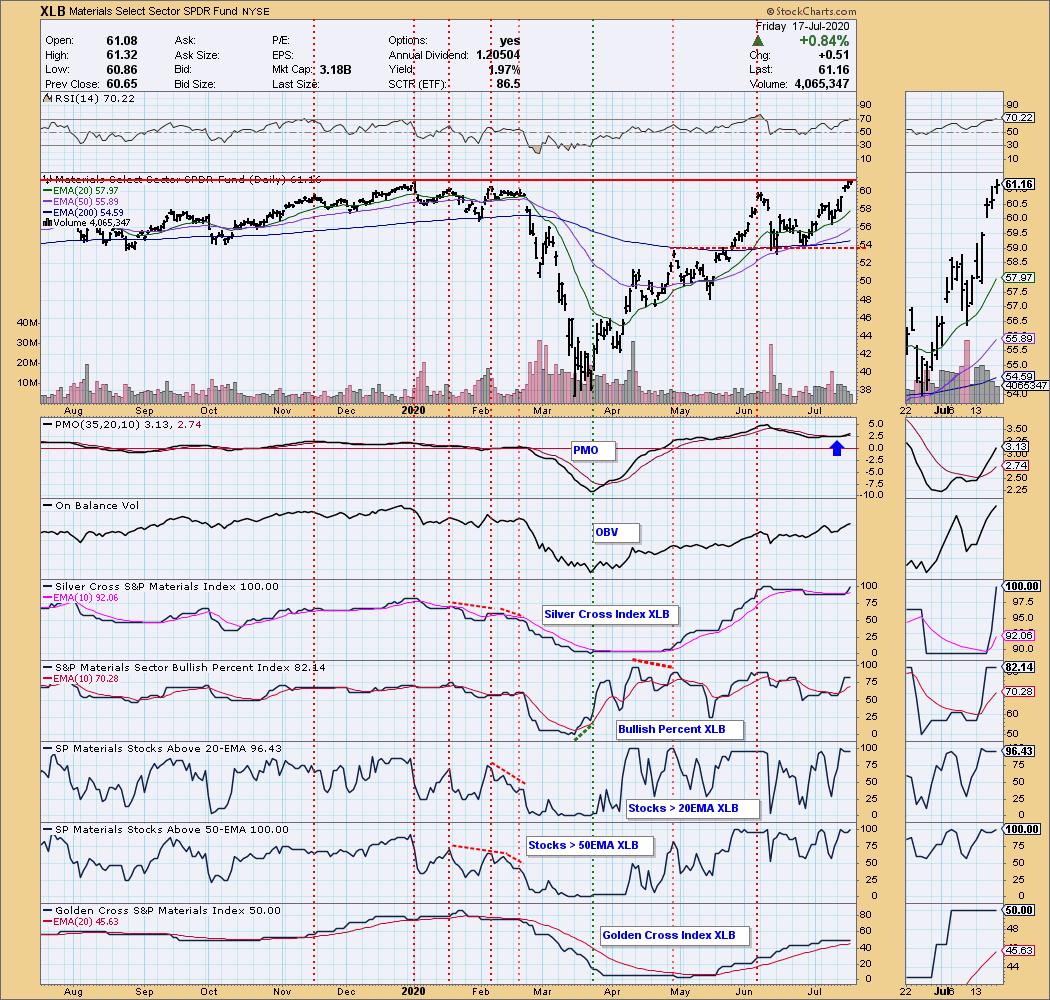
As part of my preparation of the "DecisionPoint Diamonds Report", I seek areas that are showing leadership, and the Materials sector has been doing just that. Materials was up 5.47% on the week, which was only second to Industrials at 5.87%. The "darling" of sectors, Technology, was the big loser this week, down -1.16%. Below is the Materials sector chart (XLB) from our DecisionPoint.com Sector ChartList. We have similar indicators and annotations for the other ten available to our subscribers.
You'll note the strength of the components in this sector as all of them are on "Silver Cross" Trend Model BUY signals (20-EMA > 50-EMA) and all them have price above their 50-EMA. Granted, the RSI is getting overbought and price is bumping against strong overhead resistance, but the PMO just generated a BUY signal. I'm looking for a breakout.
Below are two of the "diamonds in the rough" that I recently highlighted in my exclusive "DecisionPoint Diamonds Report". You get this same type of analysis of 15 stocks a week for only $25/mo...that's 60 stocks each month! (FYI, the price of these reports will be going up substantially based on the amount of information and analysis that it takes to put these reports together. Lock in the $25/mo price now.)
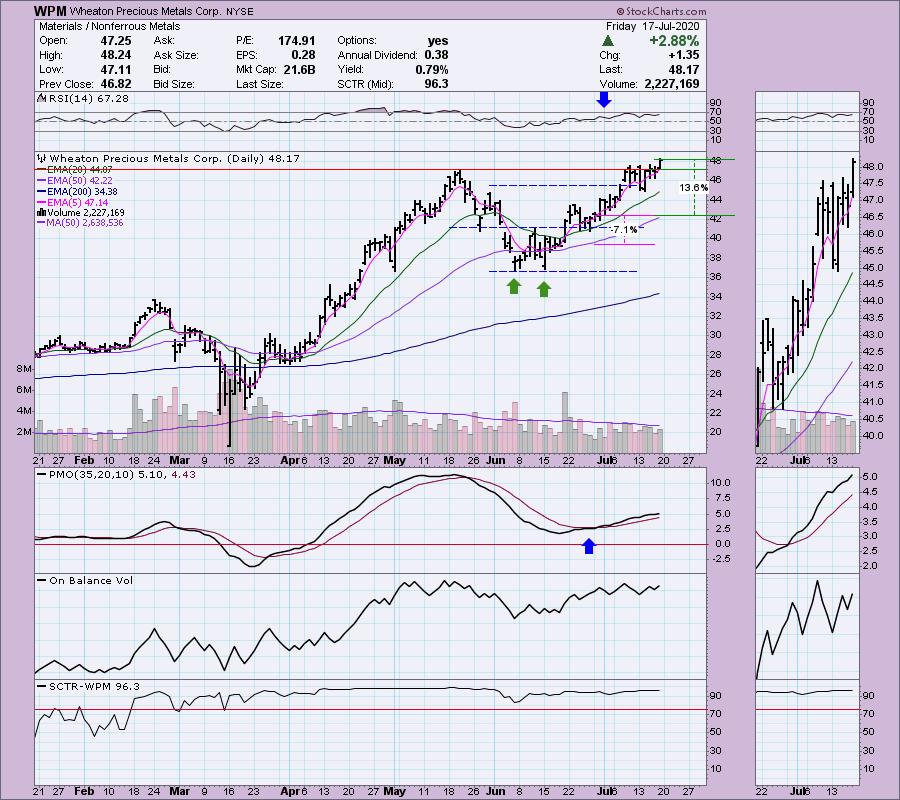
Wheaton Precious Metals Corp (WPM) - Earnings: 8/12/2020
I presented Wheaton Precious Metals (WPM) on June 29th. Below is the analysis I presented of the chart below at that time. Since then, it has continued to perform. Notice that we got the breakout above the May top as the "cup and handle" pattern suggested. I still like this one. The pink percentage is what I suggested as a possible stop area. The green is the gain so far, close to close.
June 29, 2020 Analysis:
"This is metal-related and I thought the chart looks great. At first I looked at this as a double-bottom, but I decided it made more sense as a "cup and handle" bullish formation. These patterns usually resolve to the upside and past the previous highs (like the May top). It is trying right now to break out of the short-term declining trend that formed the 'handle.' The RSI is very positive and the PMO has nearly generated a crossover BUY signal. The OBV is confirming the move with rising bottoms."
As investors, we want to accomplish two basic things: (1) Determine the trend and condition of the market and (2) select stocks that will ride that tide. The DecisionPoint Alert helps with the first step, and DecisionPoint Diamonds helps with the second. Go to DecisionPoint.com and SUBSCRIBE TODAY! (Charter Subscriber Discounts Available!)

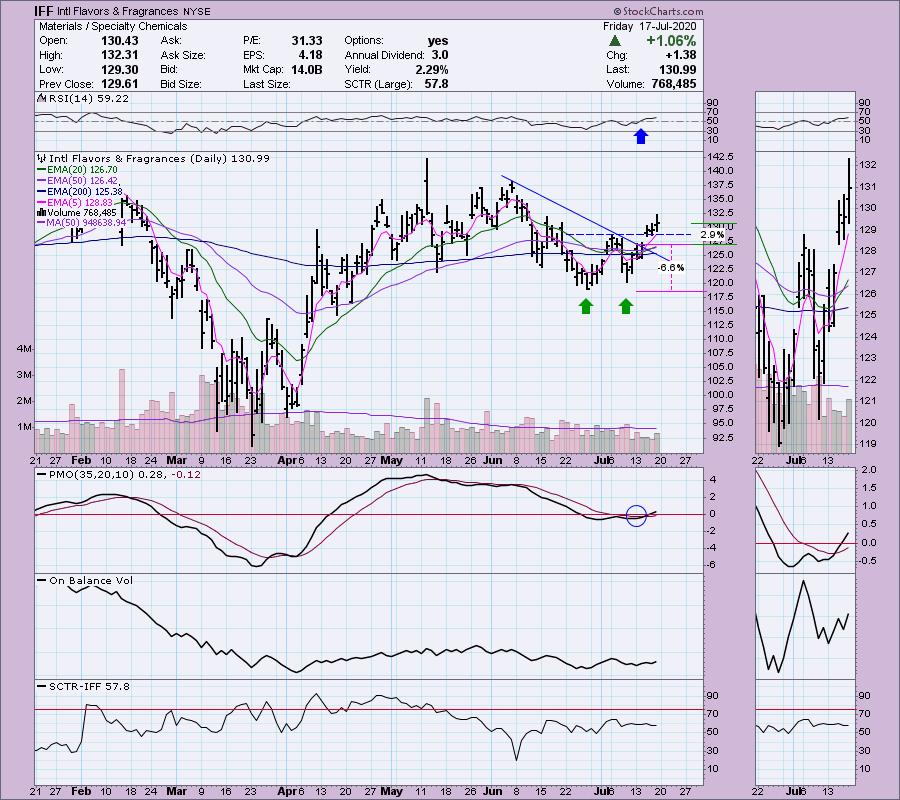
Intl Flavors & Fragrances (IFF) - Earnings: 8/3/2020
This one was my "Diamond of the Week" on this week's DecisionPoint show (watch on YouTube here!). However, I first presented this one last Tuesday. Since then, the double-bottom has resolved upward as expected. The RSI is moving further into positive territory. The pink percentage is what I suggested as a possible stop area. The green is the gain so far, close to close.
July 14, 2020 Analysis:
"I liked the double-bottom on this one. Materials had a good day and I suspect that was why so many landed in the scan results. I liked this one best. You can set a reasonable stop. It just barely broke above the declining tops trendline. The RSI did go positive today and the OBV bottoms are rising with price."
Conclusion: These are only two of my "diamonds in the rough." 95% of my portfolio stocks/ETFs come from the diamonds that I "mine" for you every week based on DecisionPoint scan results. There are 60 diamonds presented every month with concise analysis that teaches you what to look for in your own investments. I approach them from a short-term perspective on the daily chart and an intermediate-term perspective on the weekly chart. Price will be going up significantly for this report, so lock in your rate now!
Happy Charting! - Erin
Technical Analysis is a windsock, not a crystal ball.
Helpful DecisionPoint Links:
DecisionPoint Alert Chart List (subscribers only)
DecisionPoint Golden Cross/Silver Cross Index Chart List (subscribers only)
DecisionPoint Sector Chart List (subscribers only)
Price Momentum Oscillator (PMO)
Swenlin Trading Oscillators (STO-B and STO-V)


