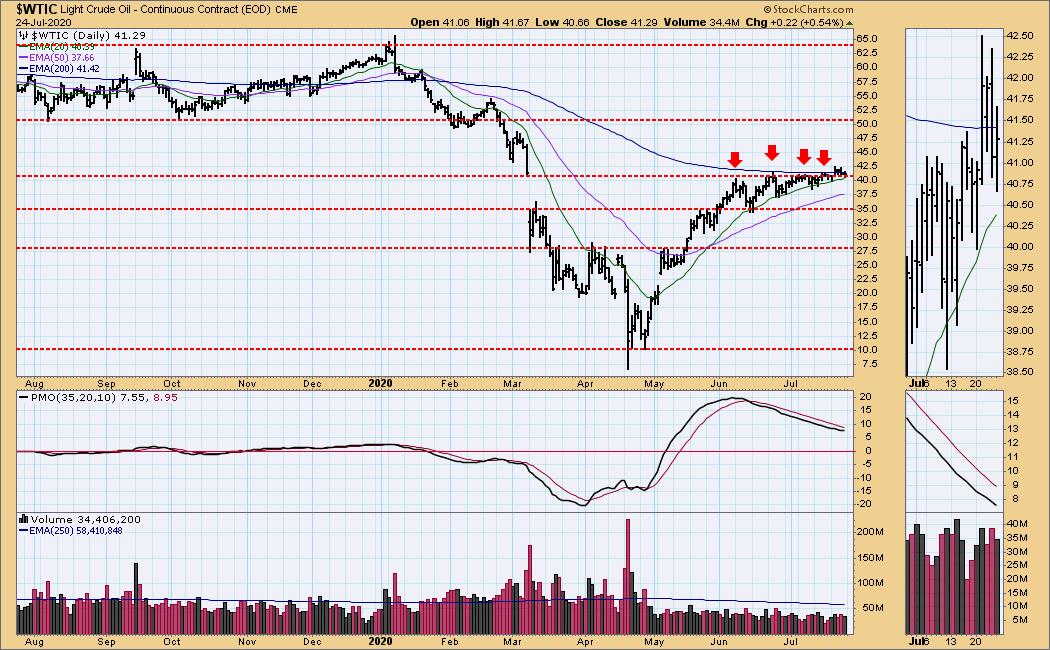
I have been watching the Energy sector closely this week. $WTIC, which I follow daily in the DecisionPoint Alert report, finally broke out and, although the Price Momentum Oscillator (PMO) hasn't turned up, Oil prices are staying above the 20-EMA and have made an attempt to get back above the 200-EMA.
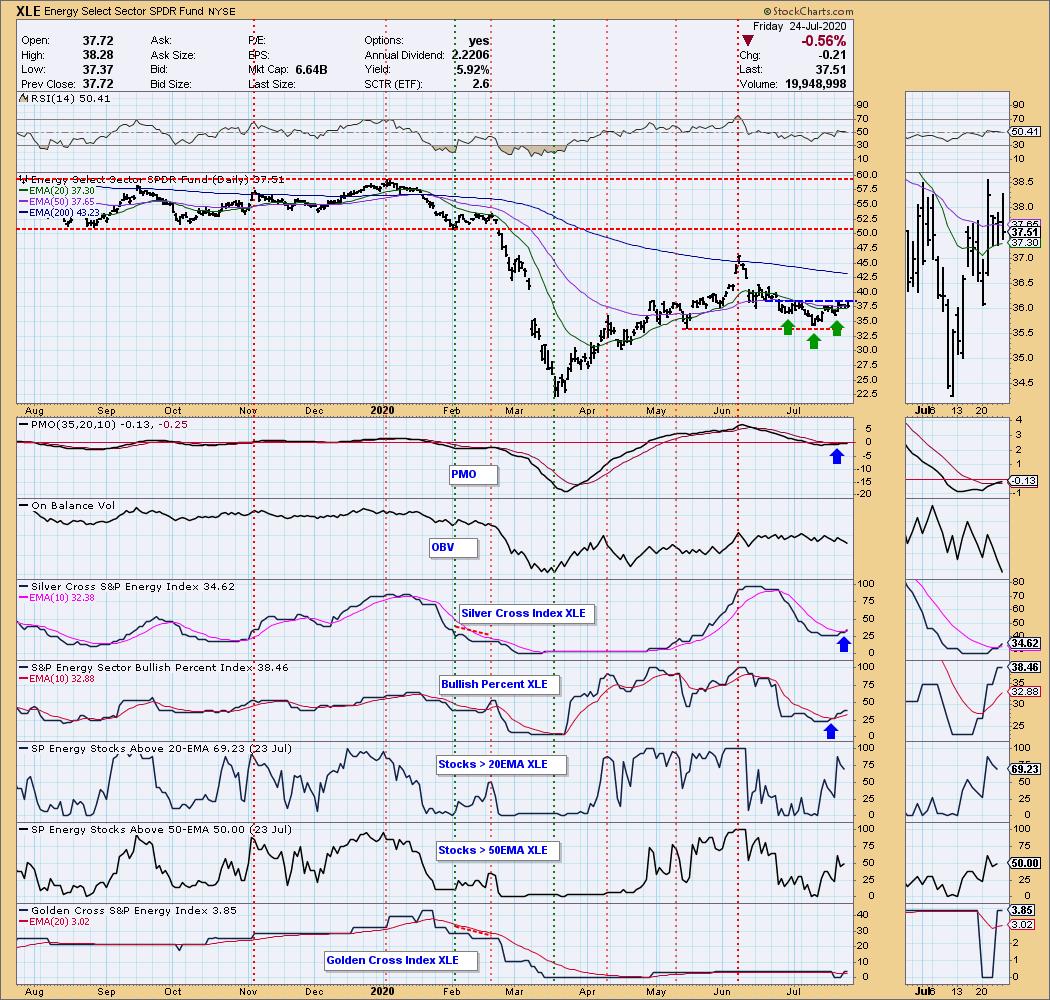
Of course, Oil is only one component of Energy (XLE). Take a look at the bullish chart for the sector. We could be catching this one early. There is a bullish reverse head-and-shoulders that is trying to execute. The PMO gave us a crossover BUY signal yesterday. The 20-EMA is about ready to cross the 50-EMA for a "silver cross" IT Trend Model BUY signal. The Silver Cross Index just had a positive crossover (this index tracks the %stocks on IT Trend Model BUY signals, meaning stocks whose 20-EMA is above their 50-EMA) and we can see a huge improvement on %stocks with prices above their 20/50-EMAs. I also like the look of the BPI.
As investors, we want to accomplish two basic things: (1) Determine the trend and condition of the market and (2) select stocks that will ride that tide. The DecisionPoint Alert helps with the first step, and DecisionPoint Diamonds helps with the second. Go to DecisionPoint.com and SUBSCRIBE TODAY! (Charter Subscriber Discounts Available!)

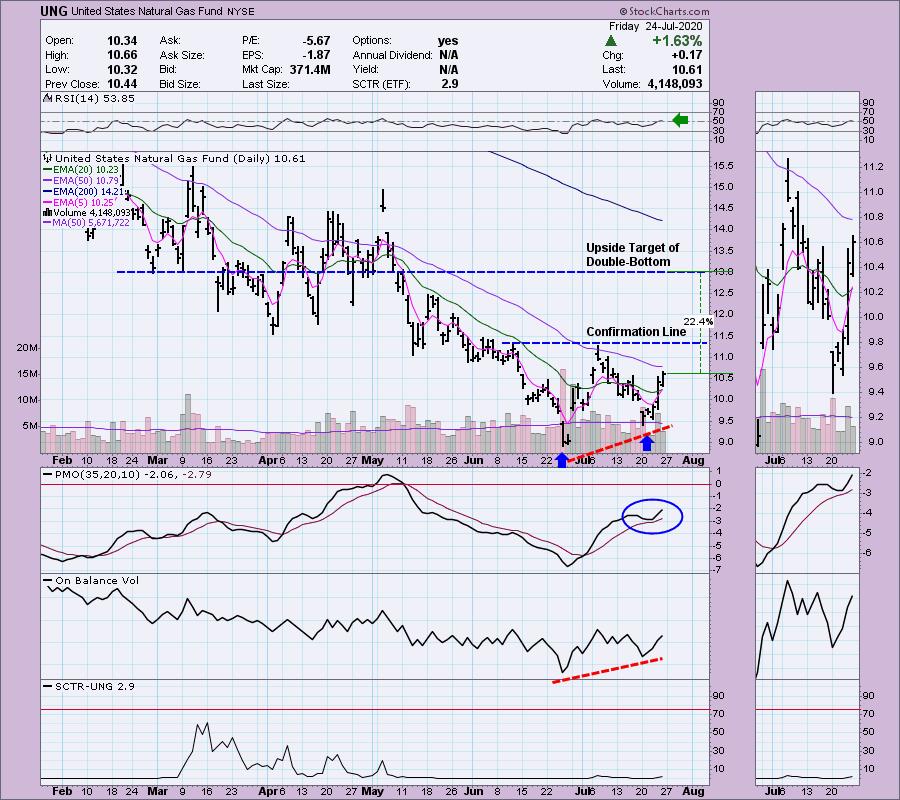
Carl texted me this morning to tell me he had taken a position in US Natural Gas Fund (UNG). It's honestly a favorite of both of ours to get into and out of. For me, it has been hit or miss, so I've avoided it this year. However, the chart is looking very bullish and, after a review, I decided to get a position in UNG as well. The double-bottom is forming (it isn't official until it breaks above the confirmation line) and, if it executes as expected to the upside, the minimum upside target is around $13. That would be a 22%+ gain from the current price today. The RSI is positive and the PMO has bottomed ABOVE its signal line, which is especially bullish. The OBV is confirming. It is a beat-down area, so the SCTR is pretty ugly, but I am not concerned about that right now. It is a symptom of the heavy decline UNG has been experiencing.
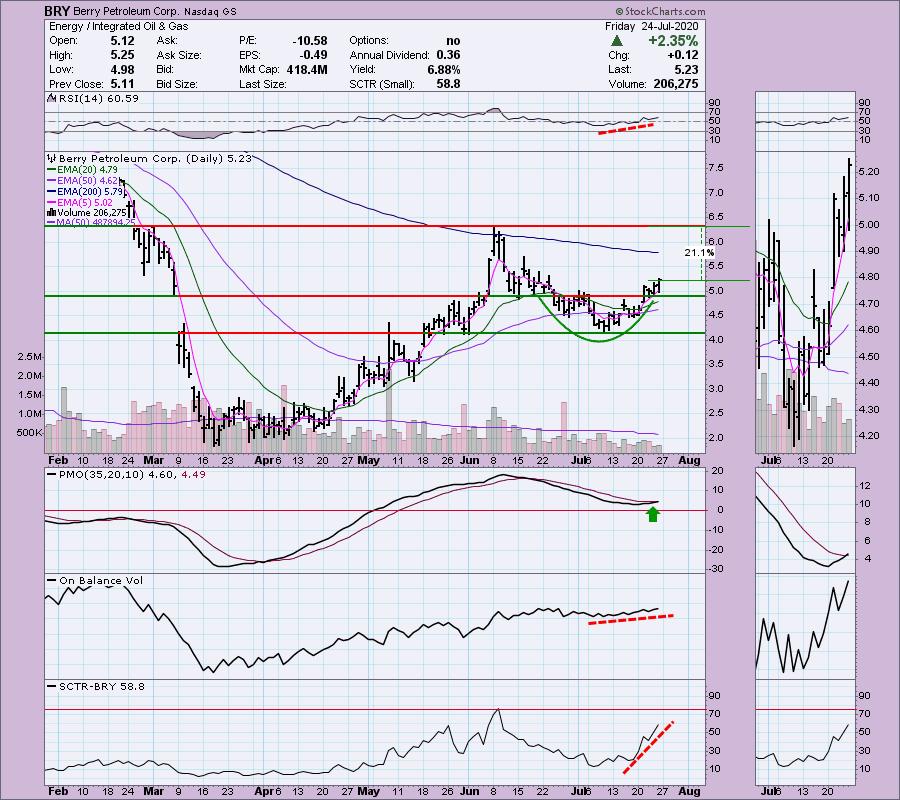
I like this small-cap oil company, Berry Petroleum Corp (BRY). The RSI is now positive and the PMO triggered a crossover BUY signal today. There is a nice cup-shaped bottom and you could even make a case that this is a breakout from a flag formation. The OBV has been confirming this rally and was already hinting at it, as OBV lows stayed relatively flat or rising while price bottoms were in decline. The SCTR has shown huge improvement, which would suggest higher prices. If price could reach the June top, that would be a 21%+ gain.
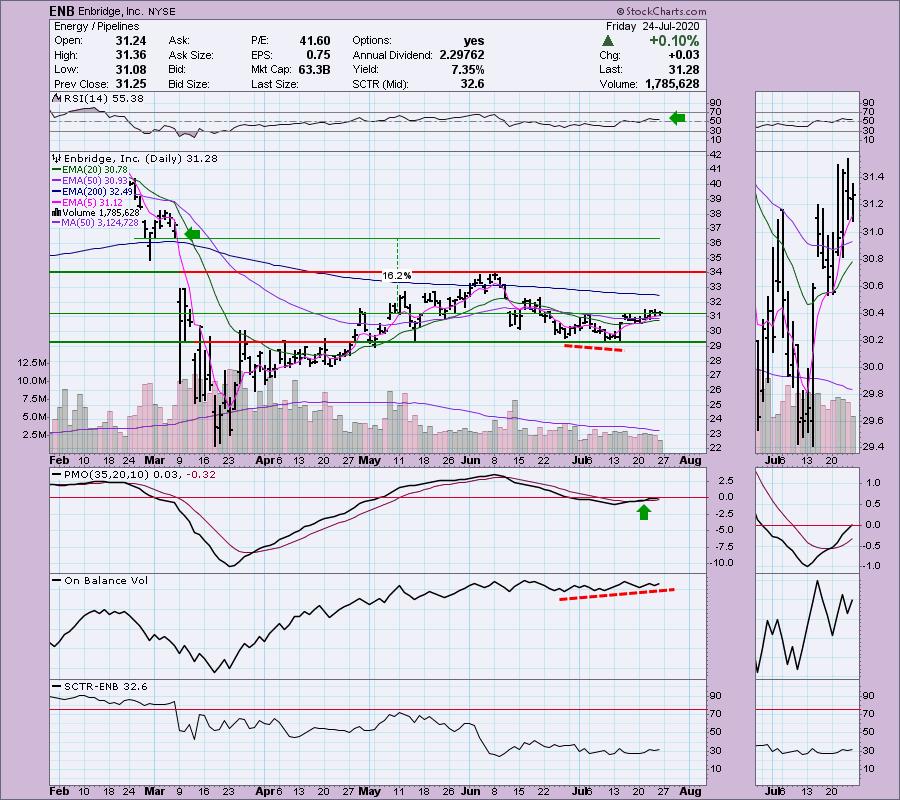
Enbridge Inc (ENB) could be in the early stages of a breakout move. The RSI is positive and the 20-EMA is rising toward a positive cross or "silver cross" of the 50-EMA, which would trigger an IT Trend Model BUY signal. Upside potential, if it can cover the March gap, would be 16%+. The PMO is on a BUY signal and just crossed above the zero line.
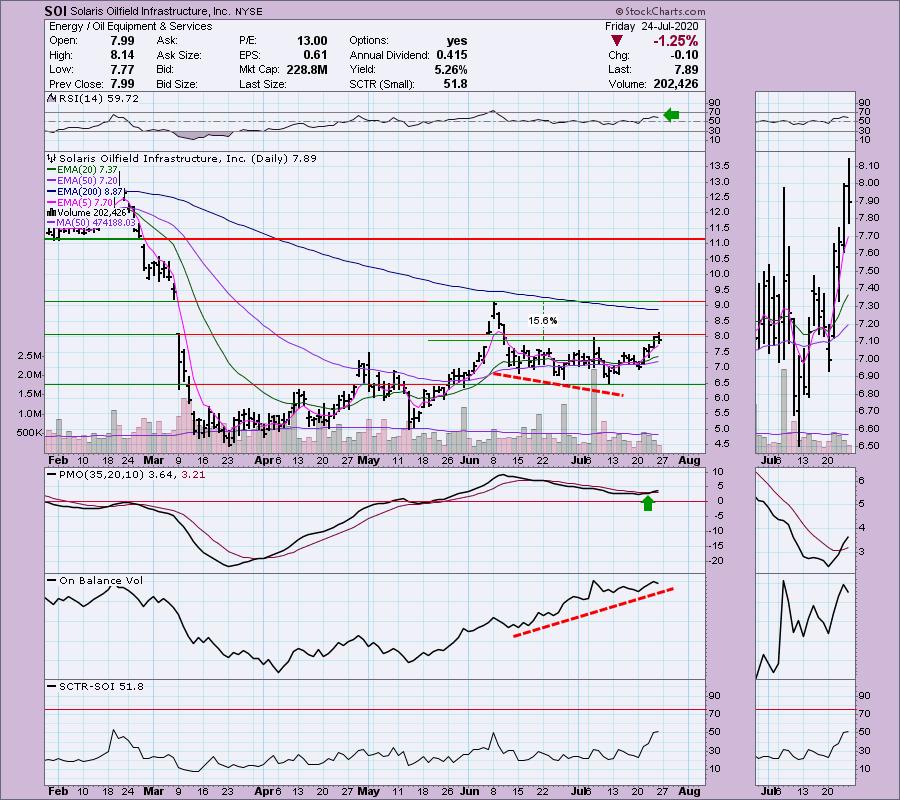
My final choice is Solaris Oilfield Infrastructure Inc (SOI). You'll see a similar cup-shaped bottom. There was an attempt at a breakout, but price fell back. It's still well above the 5-EMA. The RSI is positive and the PMO is on a BUY signal. If price can reach the June top, that would be a nice 15%+ gain.
Conclusion: The Energy sector appears to be heating up as Oil is attempting a breakout. The XLE chart is very bullish and the Energy stocks above with UNG have very nice upside potential. Full disclosure: I own UNG and am likely going to add BRY to my portfolio next week. If you like seeing my picks in ChartWatchers, you'll love the DP Diamonds reports! At $25/mo, you get 60 picks with similar analysis to the above. The price will be going up substantially, so lock in your low rate today!
Happy Charting! - Erin
Technical Analysis is a windsock, not a crystal ball.
Helpful DecisionPoint Links:
DecisionPoint Alert Chart List (subscribers only)
DecisionPoint Golden Cross/Silver Cross Index Chart List (subscribers only)
DecisionPoint Sector Chart List (subscribers only)
Price Momentum Oscillator (PMO)
Swenlin Trading Oscillators (STO-B and STO-V)


