 QQQ can do little wrong here in 2020, but the ETF is ripe for a corrective period as it becomes the most extended since 1999. Current conditions, while frothy, are not quite the same as they were in 2000 so I do not expect another crash. For those of us old enough to remember, dotcom stocks were valued using a multiple of sales because there were no earnings at the time! There are earnings this time, but this does not decrease the odds of a correction.
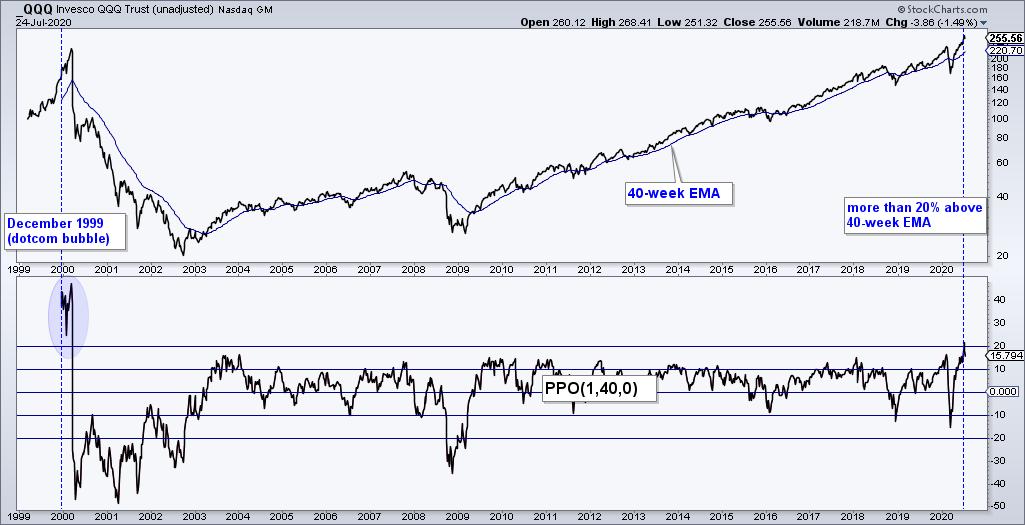
The first chart shows QQQ, the 40-week EMA and the PPO(1,40,1), which measures the percentage difference between the 1-week EMA and 40-week EMA. QQQ is currently over 20% above its 40-week EMA and this is the most since early 2000. QQQ began trading in March 1999 and was over 40% above its 40-week EMA in December 1999. The ETF advanced another 40% into March 2000 and the rest is history.
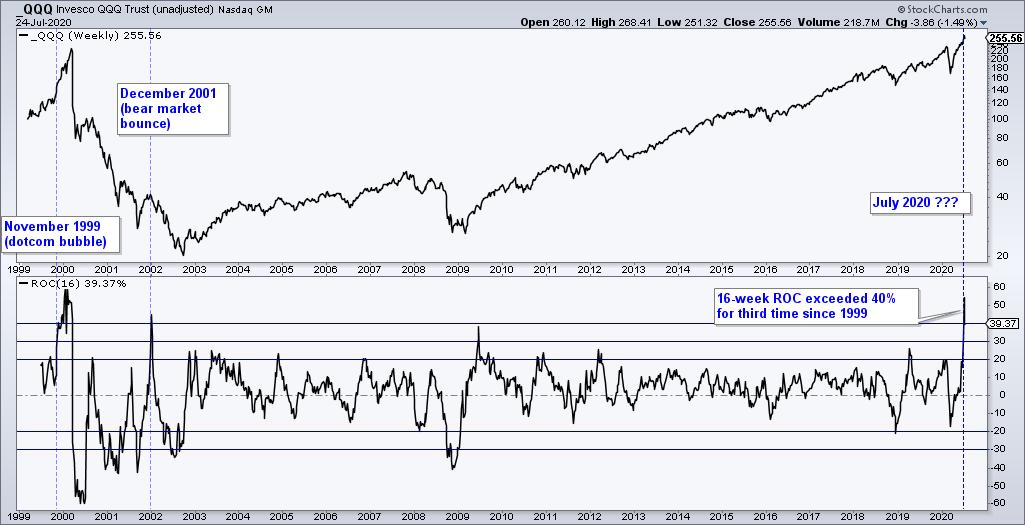
The next chart shows QQQ with the 16-week Rate-of-Change in the indicator window. I chose 16 weeks because this covers the advance from the March low to the July high and I would like to compare it to other 16 week periods. Three weeks ago, 16-week ROC exceeded 40% for the third time since 1999. The first occurred in November 1999. QQQ advanced another 50% into March and then turned lower. The second occurred in January 2002 and marked the peak of a bear market rally.
There are not enough extremely extended instances to build a strategy or to suggest some probabilities. Nevertheless, QQQ is up over 50% and the last pullback greater than 5% occurred on April 1st. QQQ is clearly extended and ripe for a correction, which could involve a sideways consolidation or a pullback to the low 240s.
This week at TrendInvestorPro.com:
Even though the S&P 500 Breadth Model turned net bullish this week, the medium-term uptrends and three key indicators remain the focus as we head into a seasonally weak period. The Bollinger Band breakouts are holding with the Home Construction ETF and Retail SPDR leading. Finance, bank and REIT ETFs are looking shaky though. Gold and Gold Miners continue to lead. All this plus two free ChartLists for StockCharts members.
Click here to take your analysis to the next level!
-------------------------------------------------------
Choose a Strategy, Develop a Plan and Follow a Process
Arthur Hill, CMT
Chief Technical Strategist, TrendInvestorPro.com
Author, Define the Trend and Trade the Trend
Want to stay up to date with Arthur's latest market insights?
– Follow @ArthurHill on Twitter


