Recent messages showing the ongoing bull market in gold (and its miners) have stressed that a weaker dollar and historically low global interest rates have pushed the price of gold to the highest level in nearly nine years. Yesterday's message showed gold rising faster than the world's major foreign currencies which is another sign of strength for the yellow metal. All of those messages have noted that investors may also be favoring gold as a hedge against an uncertain stock market environment in the face of the COVID-19 pandemic. We'll deal with the changing relationship between gold and stocks in this message.
Chart 1 plots a relative strength ratio of the price of gold divided by the Dow Industrials over the last fifty years. [Because of its long history, the Dow is usually used in comparisons to the gold market.] The chart shows the rising ratio favoring gold during the hyper-inflationary 1970s when gold and other commodities soared; and a falling ratio during the two-decade long bull market in stocks between 1980 and 2000 which favored stocks over gold. The rising ratio between 2000 and 2008 swung back in favor of gold as the commodity rose during the so-called lost decade for stocks which included two major bear markets. The gold/Dow ratio peaked in 2011 and fell for the next seven years during the decade-long bull market in stocks. The bottom right of the chart, however, shows the ratio starting to rise over the last two years (see circle) which suggests that the long-term relationship between the two markets may be shifting back in favor of gold.
 Chart 1
Chart 2 plots the same gold/Dow ratio over the last decade. It shows the ratio peaking during 2011 (along with price of gold) and falling until the second half of 2018. The rising ratio broke the major downtrend line near the end of 2018 and rose from the fourth quarter of that year until March of this year as gold rose faster than stocks. That period includes the sharp drop in stock prices during the fourth quarter of 2018 and the first quarter of this year. The ratio dipped again during the second quarter of this year as stock prices rose sharply. The flat horizontal line shows the ratio stalling near its early 2016 peak before pulling back. The overall look of the chart suggests that the gold/Dow ratio may be bottoming. And may suggest why investors are using the current pullback in the ratio to do some prospecting for gold. And its miners.
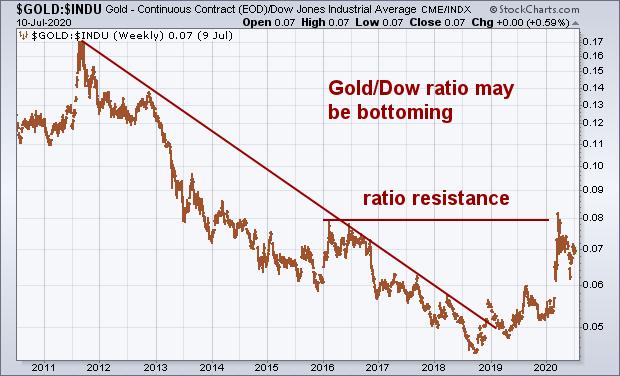 Chart 2
One of my recent charts showed gold miners rising faster than the metal itself which is normal during uptrends. Their stronger performance is also reflected in our next chart. The monthly bars in Chart 3 plot a ratio of the VanEck Vectors Gold Miners ETF (GDX) divided by the S&P 500. The chart shows two notable bottoms formed in the ratio between 2015 and 2018 following a four-year decline starting in 2011 when gold peaked. The ratio also reached a four-year high this month reflecting outperformance over the S&P 500. The ratio still needs to clear its 2016 peak to confirm that a bottom has been formed in the ratio. But the overall shape of the chart suggests a bottom is being formed. Which is more supporting evidence that investors are turning to gold assets as a hedge against the uncertainties of stocks in the midst of the global pandemic.
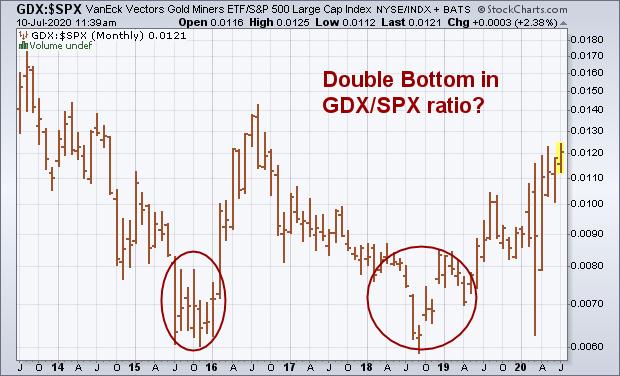 Chart 3
Editor's Note: This is an article that was originally published in John Murphy's Market Message on Friday, July 10th at 12:24pm ET.


